Deploying and Scaling Microservices
with Docker and Kubernetes
Self-paced version
A brief introduction
This was initially written by Jérôme Petazzoni to support in-person, instructor-led workshops and tutorials
Credit is also due to multiple contributors — thank you!
You can also follow along on your own, at your own pace
We included as much information as possible in these slides
We recommend having a mentor to help you ...
... Or be comfortable spending some time reading the Kubernetes documentation ...
... And looking for answers on StackOverflow and other outlets
Hands on, you shall practice
Nobody ever became a Jedi by spending their lives reading Wookiepedia
Likewise, it will take more than merely reading these slides to make you an expert
These slides include tons of exercises and examples
They assume that you have access to a Kubernetes cluster
If you are attending a workshop or tutorial:
you will be given specific instructions to access your clusterIf you are doing this on your own:
the first chapter will give you various options to get your own cluster
Accessing these slides now
We recommend that you open these slides in your browser:
Use arrows to move to next/previous slide
(up, down, left, right, page up, page down)
Type a slide number + ENTER to go to that slide
The slide number is also visible in the URL bar
(e.g. .../#123 for slide 123)
Accessing these slides later
Slides will remain online so you can review them later if needed
(let's say we'll keep them online at least 1 year, how about that?)
You can download the slides using that URL:
http://container.training/slides.zip
(then open the file
kube-selfpaced.yml.html)You will find new versions of these slides on:
These slides are open source
You are welcome to use, re-use, share these slides
These slides are written in markdown
The sources of these slides are available in a public GitHub repository:
Typos? Mistakes? Questions? Feel free to hover over the bottom of the slide ...
👇 Try it! The source file will be shown and you can view it on GitHub and fork and edit it.
Extra details
This slide has a little magnifying glass in the top left corner
This magnifying glass indicates slides that provide extra details
Feel free to skip them if:
you are in a hurry
you are new to this and want to avoid cognitive overload
you want only the most essential information
You can review these slides another time if you want, they'll be waiting for you ☺
Part 3
(auto-generated TOC)
Part 4
- Setting up Kubernetes
- Running a local development cluster
- Deploying a managed cluster
- Kubernetes distributions and installers
- The Kubernetes dashboard
- Security implications of
kubectl apply - k9s
- Tilt
- Scaling our demo app
- Daemon sets
- Labels and selectors
- Authoring YAML
(auto-generated TOC)
Part 6
(auto-generated TOC)
Part 7
- Exposing HTTP services with Ingress resources
- Ingress and TLS certificates
- cert-manager
- Kustomize
- Managing stacks with Helm
- Helm chart format
- Creating a basic chart
- Creating better Helm charts
- Charts using other charts
- Helm and invalid values
- Helm secrets
- CI/CD with GitLab
(auto-generated TOC)
Part 8
(auto-generated TOC)
Part 9
(auto-generated TOC)
Part 10
(auto-generated TOC)
Part 11
- Centralized logging
- Collecting metrics with Prometheus
- Prometheus and Grafana
- Resource Limits
- Defining min, max, and default resources
- Namespace quotas
- Limiting resources in practice
- Checking Node and Pod resource usage
- Cluster sizing
- The Horizontal Pod Autoscaler
- Scaling with custom metrics
(auto-generated TOC)
Part 12
- Extending the Kubernetes API
- API server internals
- Custom Resource Definitions
- The Aggregation Layer
- Dynamic Admission Control
- Operators
- Designing an operator
- Kubebuilder
- Sealed Secrets
- Policy Management with Kyverno
- An ElasticSearch Operator
- Finalizers
- Owners and dependents
- Events
(auto-generated TOC)
Part 13
(auto-generated TOC)
Part 14
(auto-generated TOC)

Pre-requirements
(automatically generated title slide)
Pre-requirements
Be comfortable with the UNIX command line
navigating directories
editing files
a little bit of bash-fu (environment variables, loops)
Some Docker knowledge
docker run,docker ps,docker buildideally, you know how to write a Dockerfile and build it
(even if it's aFROMline and a couple ofRUNcommands)
It's totally OK if you are not a Docker expert!
Tell me and I forget.
Teach me and I remember.
Involve me and I learn.
Misattributed to Benjamin Franklin
(Probably inspired by Chinese Confucian philosopher Xunzi)
Hands-on sections
The whole workshop is hands-on
We are going to build, ship, and run containers!
You are invited to reproduce all the demos
All hands-on sections are clearly identified, like the gray rectangle below
This is the stuff you're supposed to do!
Go to http://container.training/ to view these slides
Doing or re-doing the workshop on your own?
Use something like Play-With-Docker or Play-With-Kubernetes
Zero setup effort; but environment are short-lived and might have limited resources
Create your own cluster (local or cloud VMs)
Small setup effort; small cost; flexible environments
Create a bunch of clusters for you and your friends (instructions)
Bigger setup effort; ideal for group training
For a consistent Kubernetes experience ...
If you are using your own Kubernetes cluster, you can use shpod
shpodprovides a shell running in a pod on your own clusterIt comes with many tools pre-installed (helm, stern...)
These tools are used in many exercises in these slides
shpodalso gives you completion and a fancy prompt
Get your own Docker nodes
If you already have some Docker nodes: great!
If not: let's get some thanks to Play-With-Docker
Log in
Create your first node
You will need a Docker ID to use Play-With-Docker.
(Creating a Docker ID is free.)
We will (mostly) interact with node1 only
These remarks apply only when using multiple nodes, of course.
Unless instructed, all commands must be run from the first VM,
node1We will only check out/copy the code on
node1During normal operations, we do not need access to the other nodes
If we had to troubleshoot issues, we would use a combination of:
SSH (to access system logs, daemon status...)
Docker API (to check running containers and container engine status)
Terminals
Once in a while, the instructions will say:
"Open a new terminal."
There are multiple ways to do this:
create a new window or tab on your machine, and SSH into the VM;
use screen or tmux on the VM and open a new window from there.
You are welcome to use the method that you feel the most comfortable with.
Tmux cheatsheet
Tmux is a terminal multiplexer like screen.
You don't have to use it or even know about it to follow along.
But some of us like to use it to switch between terminals.
It has been preinstalled on your workshop nodes.
- Ctrl-b c → creates a new window
- Ctrl-b n → go to next window
- Ctrl-b p → go to previous window
- Ctrl-b " → split window top/bottom
- Ctrl-b % → split window left/right
- Ctrl-b Alt-1 → rearrange windows in columns
- Ctrl-b Alt-2 → rearrange windows in rows
- Ctrl-b arrows → navigate to other windows
- Ctrl-b d → detach session
- tmux attach → reattach to session
Versions installed
- Kubernetes 1.19.2
- Docker Engine 19.03.13
- Docker Compose 1.25.4
- Check all installed versions:kubectl versiondocker versiondocker-compose -v
Kubernetes and Docker compatibility
Kubernetes 1.17 validates Docker Engine version up to 19.03
however ...
Kubernetes 1.15 validates Docker Engine versions up to 18.09
(the latest version when Kubernetes 1.14 was released)Kubernetes 1.13 only validates Docker Engine versions up to 18.06
Is it a problem if I use Kubernetes with a "too recent" Docker Engine?
No!
"Validates" = continuous integration builds with very extensive (and expensive) testing
The Docker API is versioned, and offers strong backward-compatibility
(if a client uses e.g. API v1.25, the Docker Engine will keep behaving the same way)
Kubernetes versioning and cadence
Kubernetes versions are expressed using semantic versioning
(a Kubernetes version is expressed as MAJOR.MINOR.PATCH)
There is a new patch release whenever needed
(generally, there is about 2 to 4 weeks between patch releases, except when a critical bug or vulnerability is found: in that case, a patch release will follow as fast as possible)
There is a new minor release approximately every 3 months
At any given time, 3 minor releases are maintained
(in other words, a given minor release is maintained about 9 months)
Kubernetes version compatibility
Should my version of kubectl match exactly my cluster version?
kubectlcan be up to one minor version older or newer than the cluster(if cluster version is 1.15.X,
kubectlcan be 1.14.Y, 1.15.Y, or 1.16.Y)Things might work with larger version differences
(but they will probably fail randomly, so be careful)
This is an example of an error indicating version compability issues:
error: SchemaError(io.k8s.api.autoscaling.v2beta1.ExternalMetricStatus):invalid object doesn't have additional propertiesCheck the documentation for the whole story about compatibility
:EN:- Kubernetes versioning and compatibility :FR:- Les versions de Kubernetes et leur compatibilité

Our sample application
(automatically generated title slide)
Our sample application
We will clone the GitHub repository onto our
node1The repository also contains scripts and tools that we will use through the workshop
- Clone the repository on
node1:git clone https://github.com/jpetazzo/container.training
(You can also fork the repository on GitHub and clone your fork if you prefer that.)
Downloading and running the application
Let's start this before we look around, as downloading will take a little time...
Go to the
dockercoinsdirectory, in the cloned repo:cd ~/container.training/dockercoinsUse Compose to build and run all containers:
docker-compose up
Compose tells Docker to build all container images (pulling the corresponding base images), then starts all containers, and displays aggregated logs.
What's this application?
What's this application?
- It is a DockerCoin miner! 💰🐳📦🚢
What's this application?
It is a DockerCoin miner! 💰🐳📦🚢
No, you can't buy coffee with DockerCoins
What's this application?
It is a DockerCoin miner! 💰🐳📦🚢
No, you can't buy coffee with DockerCoins
How DockerCoins works:
generate a few random bytes
hash these bytes
increment a counter (to keep track of speed)
repeat forever!
What's this application?
It is a DockerCoin miner! 💰🐳📦🚢
No, you can't buy coffee with DockerCoins
How DockerCoins works:
generate a few random bytes
hash these bytes
increment a counter (to keep track of speed)
repeat forever!
DockerCoins is not a cryptocurrency
(the only common points are "randomness," "hashing," and "coins" in the name)
DockerCoins in the microservices era
DockerCoins is made of 5 services:
rng= web service generating random byteshasher= web service computing hash of POSTed dataworker= background process callingrngandhasherwebui= web interface to watch progressredis= data store (holds a counter updated byworker)
These 5 services are visible in the application's Compose file, docker-compose.yml
How DockerCoins works
workerinvokes web servicerngto generate random bytesworkerinvokes web servicehasherto hash these bytesworkerdoes this in an infinite loopevery second,
workerupdatesredisto indicate how many loops were donewebuiqueriesredis, and computes and exposes "hashing speed" in our browser
(See diagram on next slide!)
Service discovery in container-land
How does each service find out the address of the other ones?
Service discovery in container-land
How does each service find out the address of the other ones?
We do not hard-code IP addresses in the code
We do not hard-code FQDNs in the code, either
We just connect to a service name, and container-magic does the rest
(And by container-magic, we mean "a crafty, dynamic, embedded DNS server")
Example in worker/worker.py
redis = Redis("redis")def get_random_bytes(): r = requests.get("http://rng/32") return r.contentdef hash_bytes(data): r = requests.post("http://hasher/", data=data, headers={"Content-Type": "application/octet-stream"})(Full source code available here)
Links, naming, and service discovery
Containers can have network aliases (resolvable through DNS)
Compose file version 2+ makes each container reachable through its service name
Compose file version 1 required "links" sections to accomplish this
Network aliases are automatically namespaced
you can have multiple apps declaring and using a service named
databasecontainers in the blue app will resolve
databaseto the IP of the blue databasecontainers in the green app will resolve
databaseto the IP of the green database
Show me the code!
You can check the GitHub repository with all the materials of this workshop:
https://github.com/jpetazzo/container.trainingThe application is in the dockercoins subdirectory
The Compose file (docker-compose.yml) lists all 5 services
redisis using an official image from the Docker Hubhasher,rng,worker,webuiare each built from a DockerfileEach service's Dockerfile and source code is in its own directory
(
hasheris in the hasher directory,rngis in the rng directory, etc.)
Compose file format version
This is relevant only if you have used Compose before 2016...
Compose 1.6 introduced support for a new Compose file format (aka "v2")
Services are no longer at the top level, but under a
servicessectionThere has to be a
versionkey at the top level, with value"2"(as a string, not an integer)Containers are placed on a dedicated network, making links unnecessary
There are other minor differences, but upgrade is easy and straightforward
Our application at work
On the left-hand side, the "rainbow strip" shows the container names
On the right-hand side, we see the output of our containers
We can see the
workerservice making requests torngandhasherFor
rngandhasher, we see HTTP access logs
Connecting to the web UI
"Logs are exciting and fun!" (No-one, ever)
The
webuicontainer exposes a web dashboard; let's view it
With a web browser, connect to
node1on port 8000Remember: the
nodeXaliases are valid only on the nodes themselvesIn your browser, you need to enter the IP address of your node
A drawing area should show up, and after a few seconds, a blue graph will appear.
If the graph doesn't load
If you just see a Page not found error, it might be because your
Docker Engine is running on a different machine. This can be the case if:
you are using the Docker Toolbox
you are using a VM (local or remote) created with Docker Machine
you are controlling a remote Docker Engine
When you run DockerCoins in development mode, the web UI static files are mapped to the container using a volume. Alas, volumes can only work on a local environment, or when using Docker Desktop for Mac or Windows.
How to fix this?
Stop the app with ^C, edit dockercoins.yml, comment out the volumes section, and try again.
Why does the speed seem irregular?
It looks like the speed is approximately 4 hashes/second
Or more precisely: 4 hashes/second, with regular dips down to zero
Why?
Why does the speed seem irregular?
It looks like the speed is approximately 4 hashes/second
Or more precisely: 4 hashes/second, with regular dips down to zero
Why?
The app actually has a constant, steady speed: 3.33 hashes/second
(which corresponds to 1 hash every 0.3 seconds, for reasons)Yes, and?
The reason why this graph is not awesome
The worker doesn't update the counter after every loop, but up to once per second
The speed is computed by the browser, checking the counter about once per second
Between two consecutive updates, the counter will increase either by 4, or by 0
The perceived speed will therefore be 4 - 4 - 4 - 0 - 4 - 4 - 0 etc.
What can we conclude from this?
- "I'm clearly incapable of writing good frontend code!" 😀 — Jérôme
Stopping the application
If we interrupt Compose (with
^C), it will politely ask the Docker Engine to stop the appThe Docker Engine will send a
TERMsignal to the containersIf the containers do not exit in a timely manner, the Engine sends a
KILLsignal
- Stop the application by hitting
^C
Stopping the application
If we interrupt Compose (with
^C), it will politely ask the Docker Engine to stop the appThe Docker Engine will send a
TERMsignal to the containersIf the containers do not exit in a timely manner, the Engine sends a
KILLsignal
- Stop the application by hitting
^C
Some containers exit immediately, others take longer.
The containers that do not handle SIGTERM end up being killed after a 10s timeout. If we are very impatient, we can hit ^C a second time!
Clean up
- Before moving on, let's remove those containers
- Tell Compose to remove everything:docker-compose down

Kubernetes concepts
(automatically generated title slide)
Kubernetes concepts
Kubernetes is a container management system
It runs and manages containerized applications on a cluster
Kubernetes concepts
Kubernetes is a container management system
It runs and manages containerized applications on a cluster
What does that really mean?
What can we do with Kubernetes?
Let's imagine that we have a 3-tier e-commerce app:
web frontend
API backend
database (that we will keep out of Kubernetes for now)
We have built images for our frontend and backend components
(e.g. with Dockerfiles and
docker build)We are running them successfully with a local environment
(e.g. with Docker Compose)
Let's see how we would deploy our app on Kubernetes!
Basic things we can ask Kubernetes to do
Basic things we can ask Kubernetes to do
- Start 5 containers using image
atseashop/api:v1.3
Basic things we can ask Kubernetes to do
Start 5 containers using image
atseashop/api:v1.3Place an internal load balancer in front of these containers
Basic things we can ask Kubernetes to do
Start 5 containers using image
atseashop/api:v1.3Place an internal load balancer in front of these containers
Start 10 containers using image
atseashop/webfront:v1.3
Basic things we can ask Kubernetes to do
Start 5 containers using image
atseashop/api:v1.3Place an internal load balancer in front of these containers
Start 10 containers using image
atseashop/webfront:v1.3Place a public load balancer in front of these containers
Basic things we can ask Kubernetes to do
Start 5 containers using image
atseashop/api:v1.3Place an internal load balancer in front of these containers
Start 10 containers using image
atseashop/webfront:v1.3Place a public load balancer in front of these containers
It's Black Friday (or Christmas), traffic spikes, grow our cluster and add containers
New release! Replace my containers with the new image
atseashop/webfront:v1.4
Basic things we can ask Kubernetes to do
Start 5 containers using image
atseashop/api:v1.3Place an internal load balancer in front of these containers
Start 10 containers using image
atseashop/webfront:v1.3Place a public load balancer in front of these containers
It's Black Friday (or Christmas), traffic spikes, grow our cluster and add containers
New release! Replace my containers with the new image
atseashop/webfront:v1.4Keep processing requests during the upgrade; update my containers one at a time
Other things that Kubernetes can do for us
Autoscaling
(straightforward on CPU; more complex on other metrics)
Resource management and scheduling
(reserve CPU/RAM for containers; placement constraints)
Advanced rollout patterns
(blue/green deployment, canary deployment)
More things that Kubernetes can do for us
Batch jobs
(one-off; parallel; also cron-style periodic execution)
Fine-grained access control
(defining what can be done by whom on which resources)
Stateful services
(databases, message queues, etc.)
Automating complex tasks with operators
(e.g. database replication, failover, etc.)
Kubernetes architecture
Ha ha ha ha
OK, I was trying to scare you, it's much simpler than that ❤️
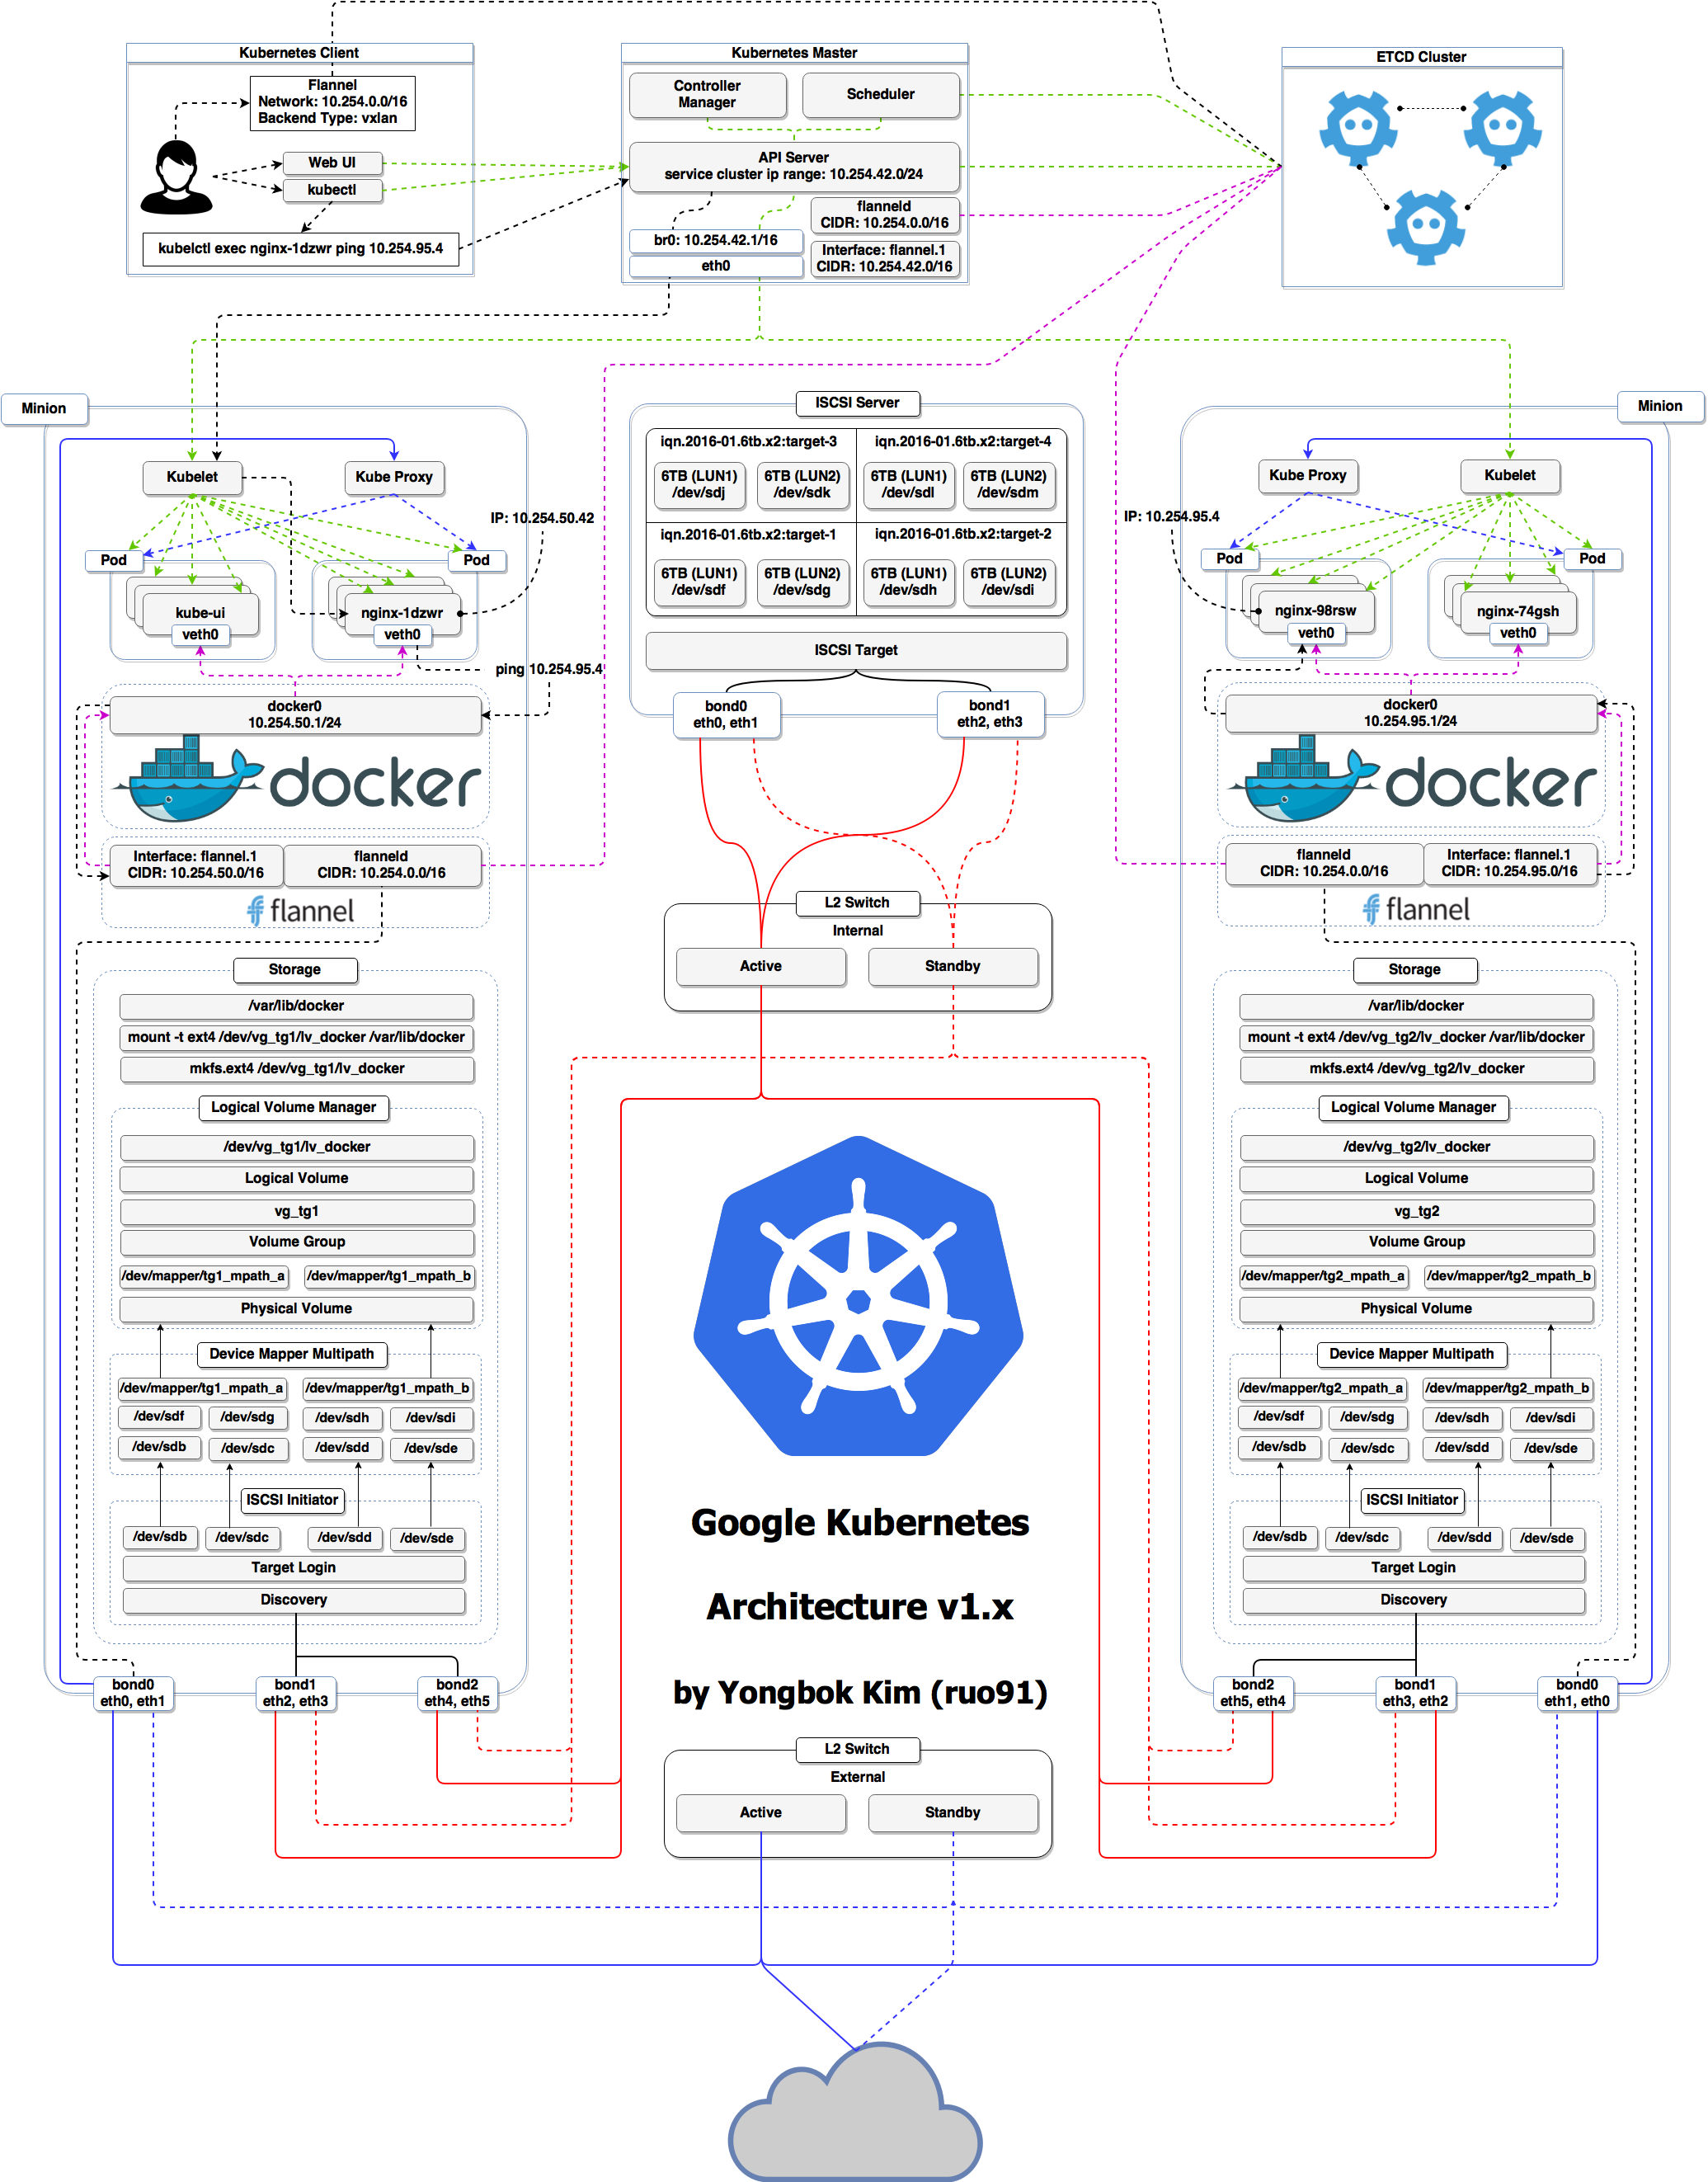
Credits
The first schema is a Kubernetes cluster with storage backed by multi-path iSCSI
(Courtesy of Yongbok Kim)
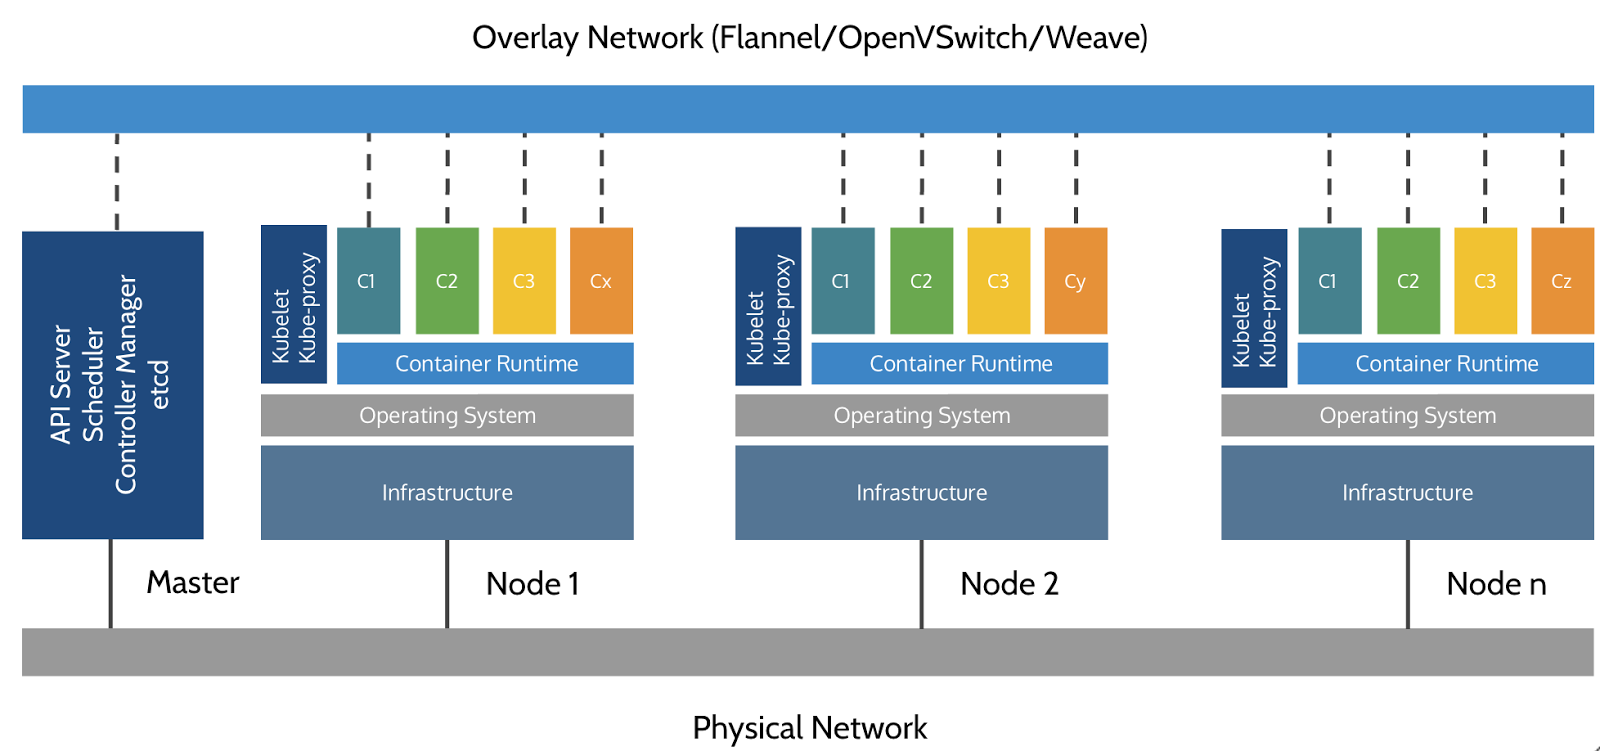
The second one is a simplified representation of a Kubernetes cluster
(Courtesy of Imesh Gunaratne)
Kubernetes architecture: the nodes
The nodes executing our containers run a collection of services:
a container Engine (typically Docker)
kubelet (the "node agent")
kube-proxy (a necessary but not sufficient network component)
Nodes were formerly called "minions"
(You might see that word in older articles or documentation)
Kubernetes architecture: the control plane
The Kubernetes logic (its "brains") is a collection of services:
the API server (our point of entry to everything!)
core services like the scheduler and controller manager
etcd(a highly available key/value store; the "database" of Kubernetes)
Together, these services form the control plane of our cluster
The control plane is also called the "master"
Running the control plane on special nodes
It is common to reserve a dedicated node for the control plane
(Except for single-node development clusters, like when using minikube)
This node is then called a "master"
(Yes, this is ambiguous: is the "master" a node, or the whole control plane?)
Normal applications are restricted from running on this node
(By using a mechanism called "taints")
When high availability is required, each service of the control plane must be resilient
The control plane is then replicated on multiple nodes
(This is sometimes called a "multi-master" setup)
Running the control plane outside containers
The services of the control plane can run in or out of containers
For instance: since
etcdis a critical service, some people deploy it directly on a dedicated cluster (without containers)(This is illustrated on the first "super complicated" schema)
In some hosted Kubernetes offerings (e.g. AKS, GKE, EKS), the control plane is invisible
(We only "see" a Kubernetes API endpoint)
In that case, there is no "master node"
For this reason, it is more accurate to say "control plane" rather than "master."


How many nodes should a cluster have?
There is no particular constraint
(no need to have an odd number of nodes for quorum)
A cluster can have zero node
(but then it won't be able to start any pods)
For testing and development, having a single node is fine
For production, make sure that you have extra capacity
(so that your workload still fits if you lose a node or a group of nodes)
Kubernetes is tested with up to 5000 nodes
(however, running a cluster of that size requires a lot of tuning)
Do we need to run Docker at all?
No!
Do we need to run Docker at all?
No!
By default, Kubernetes uses the Docker Engine to run containers
We can leverage other pluggable runtimes through the Container Runtime Interface
We could also use(deprecated)rkt("Rocket") from CoreOS
Some runtimes available through CRI
-
- maintained by Docker, IBM, and community
- used by Docker Engine, microk8s, k3s, GKE; also standalone
- comes with its own CLI,
ctr
-
- maintained by Red Hat, SUSE, and community
- used by OpenShift and Kubic
- designed specifically as a minimal runtime for Kubernetes
Do we need to run Docker at all?
Yes!
Do we need to run Docker at all?
Yes!
In this workshop, we run our app on a single node first
We will need to build images and ship them around
We can do these things without Docker
(and get diagnosed with NIH¹ syndrome)Docker is still the most stable container engine today
(but other options are maturing very quickly)
Do we need to run Docker at all?
On our development environments, CI pipelines ... :
Yes, almost certainly
On our production servers:
Yes (today)
Probably not (in the future)
More information about CRI on the Kubernetes blog
Interacting with Kubernetes
We will interact with our Kubernetes cluster through the Kubernetes API
The Kubernetes API is (mostly) RESTful
It allows us to create, read, update, delete resources
A few common resource types are:
node (a machine — physical or virtual — in our cluster)
pod (group of containers running together on a node)
service (stable network endpoint to connect to one or multiple containers)
Scaling
How would we scale the pod shown on the previous slide?
Do create additional pods
each pod can be on a different node
each pod will have its own IP address
Do not add more NGINX containers in the pod
all the NGINX containers would be on the same node
they would all have the same IP address
(resulting inAddress alreading in useerrors)
Together or separate
Should we put e.g. a web application server and a cache together?
("cache" being something like e.g. Memcached or Redis)Putting them in the same pod means:
they have to be scaled together
they can communicate very efficiently over
localhost
Putting them in different pods means:
they can be scaled separately
they must communicate over remote IP addresses
(incurring more latency, lower performance)
Both scenarios can make sense, depending on our goals
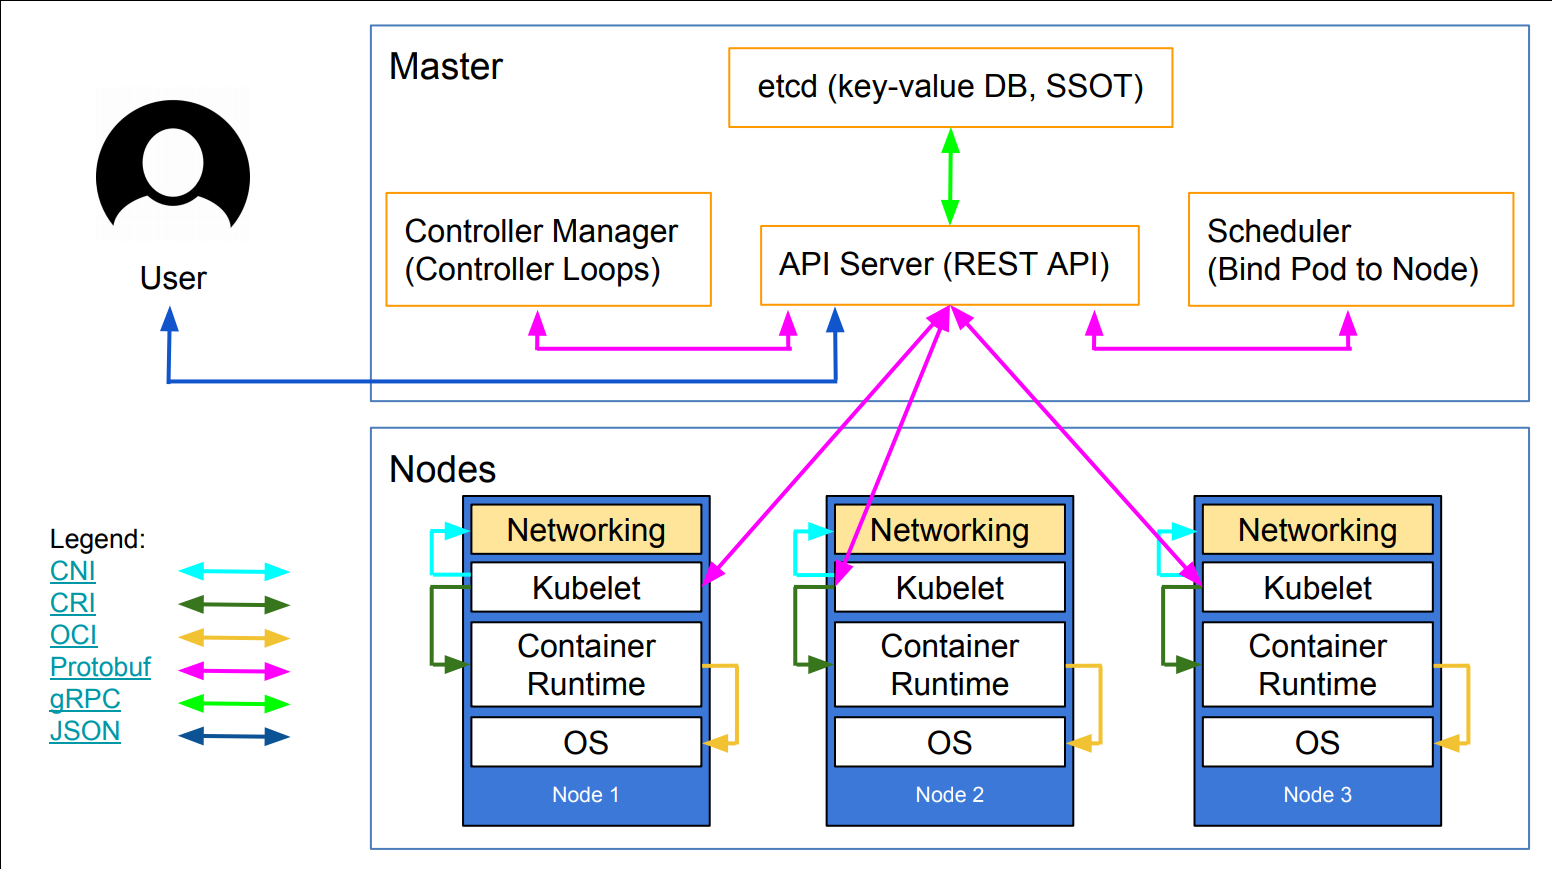
Credits
The first diagram is courtesy of Lucas Käldström, in this presentation
- it's one of the best Kubernetes architecture diagrams available!
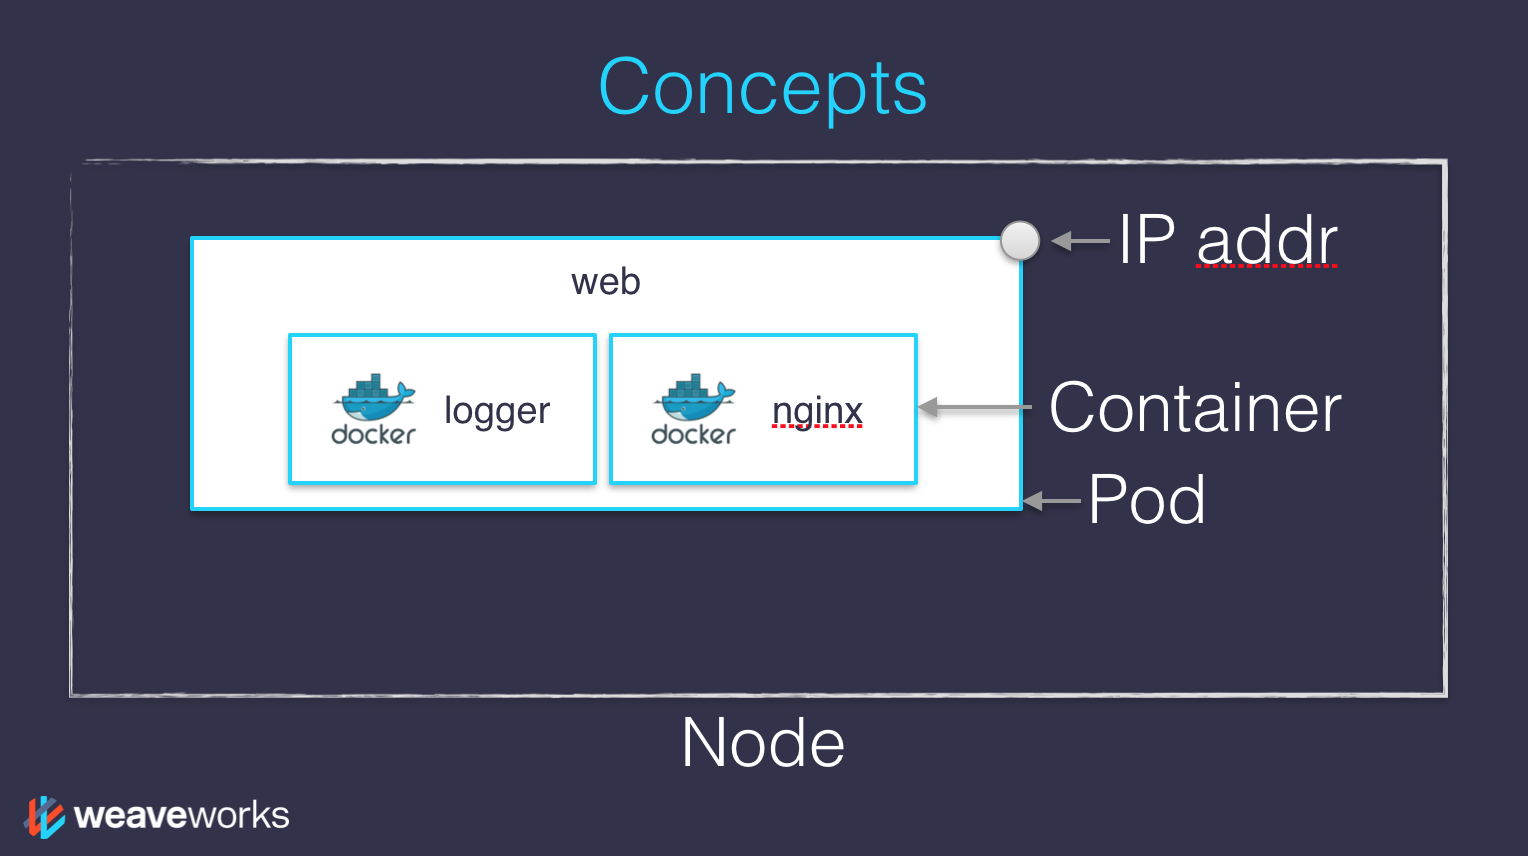
The second diagram is courtesy of Weave Works
a pod can have multiple containers working together
IP addresses are associated with pods, not with individual containers
Both diagrams used with permission.
:EN:- Kubernetes concepts :FR:- Kubernetes en théorie

First contact with kubectl
(automatically generated title slide)
First contact with kubectl
kubectlis (almost) the only tool we'll need to talk to KubernetesIt is a rich CLI tool around the Kubernetes API
(Everything you can do with
kubectl, you can do directly with the API)On our machines, there is a
~/.kube/configfile with:the Kubernetes API address
the path to our TLS certificates used to authenticate
You can also use the
--kubeconfigflag to pass a config fileOr directly
--server,--user, etc.kubectlcan be pronounced "Cube C T L", "Cube cuttle", "Cube cuddle"...
kubectl is the new SSH
We often start managing servers with SSH
(installing packages, troubleshooting ...)
At scale, it becomes tedious, repetitive, error-prone
Instead, we use config management, central logging, etc.
In many cases, we still need SSH:
as the underlying access method (e.g. Ansible)
to debug tricky scenarios
to inspect and poke at things
The parallel with kubectl
We often start managing Kubernetes clusters with
kubectl(deploying applications, troubleshooting ...)
At scale (with many applications or clusters), it becomes tedious, repetitive, error-prone
Instead, we use automated pipelines, observability tooling, etc.
In many cases, we still need
kubectl:to debug tricky scenarios
to inspect and poke at things
The Kubernetes API is always the underlying access method
kubectl get
- Let's look at our
Noderesources withkubectl get!
Look at the composition of our cluster:
kubectl get nodeThese commands are equivalent:
kubectl get nokubectl get nodekubectl get nodes
Obtaining machine-readable output
kubectl getcan output JSON, YAML, or be directly formatted
Give us more info about the nodes:
kubectl get nodes -o wideLet's have some YAML:
kubectl get no -o yamlSee that
kind: Listat the end? It's the type of our result!
(Ab)using kubectl and jq
- It's super easy to build custom reports
- Show the capacity of all our nodes as a stream of JSON objects:kubectl get nodes -o json |jq ".items[] | {name:.metadata.name} + .status.capacity"
Exploring types and definitions
We can list all available resource types by running
kubectl api-resources
(In Kubernetes 1.10 and prior, this command used to bekubectl get)We can view the definition for a resource type with:
kubectl explain typeWe can view the definition of a field in a resource, for instance:
kubectl explain node.specOr get the full definition of all fields and sub-fields:
kubectl explain node --recursive
Introspection vs. documentation
We can access the same information by reading the API documentation
The API documentation is usually easier to read, but:
it won't show custom types (like Custom Resource Definitions)
we need to make sure that we look at the correct version
kubectl api-resourcesandkubectl explainperform introspection(they communicate with the API server and obtain the exact type definitions)
Type names
The most common resource names have three forms:
singular (e.g.
node,service,deployment)plural (e.g.
nodes,services,deployments)short (e.g.
no,svc,deploy)
Some resources do not have a short name
Endpointsonly have a plural form(because even a single
Endpointsresource is actually a list of endpoints)
Viewing details
We can use
kubectl get -o yamlto see all available detailsHowever, YAML output is often simultaneously too much and not enough
For instance,
kubectl get node node1 -o yamlis:too much information (e.g.: list of images available on this node)
not enough information (e.g.: doesn't show pods running on this node)
difficult to read for a human operator
For a comprehensive overview, we can use
kubectl describeinstead
kubectl describe
kubectl describeneeds a resource type and (optionally) a resource nameIt is possible to provide a resource name prefix
(all matching objects will be displayed)
kubectl describewill retrieve some extra information about the resource
- Look at the information available for
node1with one of the following commands:kubectl describe node/node1kubectl describe node node1
(We should notice a bunch of control plane pods.)
Listing running containers
Containers are manipulated through pods
A pod is a group of containers:
running together (on the same node)
sharing resources (RAM, CPU; but also network, volumes)
- List pods on our cluster:kubectl get pods
Listing running containers
Containers are manipulated through pods
A pod is a group of containers:
running together (on the same node)
sharing resources (RAM, CPU; but also network, volumes)
- List pods on our cluster:kubectl get pods
Where are the pods that we saw just a moment earlier?!?
Namespaces
- Namespaces allow us to segregate resources
- List the namespaces on our cluster with one of these commands:kubectl get namespaceskubectl get namespacekubectl get ns
Namespaces
- Namespaces allow us to segregate resources
- List the namespaces on our cluster with one of these commands:kubectl get namespaceskubectl get namespacekubectl get ns
You know what ... This kube-system thing looks suspicious.
In fact, I'm pretty sure it showed up earlier, when we did:
kubectl describe node node1
Accessing namespaces
By default,
kubectluses thedefaultnamespaceWe can see resources in all namespaces with
--all-namespaces
List the pods in all namespaces:
kubectl get pods --all-namespacesSince Kubernetes 1.14, we can also use
-Aas a shorter version:kubectl get pods -A
Here are our system pods!
What are all these control plane pods?
etcdis our etcd serverkube-apiserveris the API serverkube-controller-managerandkube-schedulerare other control plane componentscorednsprovides DNS-based service discovery (replacing kube-dns as of 1.11)kube-proxyis the (per-node) component managing port mappings and suchweaveis the (per-node) component managing the network overlaythe
READYcolumn indicates the number of containers in each pod(1 for most pods, but
weavehas 2, for instance)
Scoping another namespace
- We can also look at a different namespace (other than
default)
- List only the pods in the
kube-systemnamespace:kubectl get pods --namespace=kube-systemkubectl get pods -n kube-system
Namespaces and other kubectl commands
We can use
-n/--namespacewith almost everykubectlcommandExample:
kubectl create --namespace=Xto create something in namespace X
We can use
-A/--all-namespaceswith most commands that manipulate multiple objectsExamples:
kubectl deletecan delete resources across multiple namespaceskubectl labelcan add/remove/update labels across multiple namespaces
What about kube-public?
- List the pods in the
kube-publicnamespace:kubectl -n kube-public get pods
Nothing!
kube-public is created by kubeadm & used for security bootstrapping.
Exploring kube-public
- The only interesting object in
kube-publicis a ConfigMap namedcluster-info
List ConfigMap objects:
kubectl -n kube-public get configmapsInspect
cluster-info:kubectl -n kube-public get configmap cluster-info -o yaml
Note the selfLink URI: /api/v1/namespaces/kube-public/configmaps/cluster-info
We can use that!
Accessing cluster-info
Earlier, when trying to access the API server, we got a
ForbiddenmessageBut
cluster-infois readable by everyone (even without authentication)
- Retrieve
cluster-info:curl -k https://10.96.0.1/api/v1/namespaces/kube-public/configmaps/cluster-info
We were able to access
cluster-info(without auth)It contains a
kubeconfigfile
Retrieving kubeconfig
- We can easily extract the
kubeconfigfile from this ConfigMap
- Display the content of
kubeconfig:curl -sk https://10.96.0.1/api/v1/namespaces/kube-public/configmaps/cluster-info \| jq -r .data.kubeconfig
This file holds the canonical address of the API server, and the public key of the CA
This file does not hold client keys or tokens
This is not sensitive information, but allows us to establish trust
What about kube-node-lease?
Starting with Kubernetes 1.14, there is a
kube-node-leasenamespace(or in Kubernetes 1.13 if the NodeLease feature gate is enabled)
That namespace contains one Lease object per node
Node leases are a new way to implement node heartbeats
(i.e. node regularly pinging the control plane to say "I'm alive!")
For more details, see KEP-0009 or the node controller documentation k8s/kubectlget.md
Services
A service is a stable endpoint to connect to "something"
(In the initial proposal, they were called "portals")
- List the services on our cluster with one of these commands:kubectl get serviceskubectl get svc
Services
A service is a stable endpoint to connect to "something"
(In the initial proposal, they were called "portals")
- List the services on our cluster with one of these commands:kubectl get serviceskubectl get svc
There is already one service on our cluster: the Kubernetes API itself.
ClusterIP services
A
ClusterIPservice is internal, available from the cluster onlyThis is useful for introspection from within containers
Try to connect to the API:
curl -k https://10.96.0.1-kis used to skip certificate verificationMake sure to replace 10.96.0.1 with the CLUSTER-IP shown by
kubectl get svc
The command above should either time out, or show an authentication error. Why?
Time out
Connections to ClusterIP services only work from within the cluster
If we are outside the cluster, the
curlcommand will probably time out(Because the IP address, e.g. 10.96.0.1, isn't routed properly outside the cluster)
This is the case with most "real" Kubernetes clusters
To try the connection from within the cluster, we can use shpod
Authentication error
This is what we should see when connecting from within the cluster:
$ curl -k https://10.96.0.1{ "kind": "Status", "apiVersion": "v1", "metadata": { }, "status": "Failure", "message": "forbidden: User \"system:anonymous\" cannot get path \"/\"", "reason": "Forbidden", "details": { }, "code": 403}Explanations
We can see
kind,apiVersion,metadataThese are typical of a Kubernetes API reply
Because we are talking to the Kubernetes API
The Kubernetes API tells us "Forbidden"
(because it requires authentication)
The Kubernetes API is reachable from within the cluster
(many apps integrating with Kubernetes will use this)
DNS integration
Each service also gets a DNS record
The Kubernetes DNS resolver is available from within pods
(and sometimes, from within nodes, depending on configuration)
Code running in pods can connect to services using their name
(e.g. https://kubernetes/...)
:EN:- Getting started with kubectl :FR:- Se familiariser avec kubectl

Running our first containers on Kubernetes
(automatically generated title slide)
Running our first containers on Kubernetes
- First things first: we cannot run a container
Running our first containers on Kubernetes
First things first: we cannot run a container
We are going to run a pod, and in that pod there will be a single container
Running our first containers on Kubernetes
First things first: we cannot run a container
We are going to run a pod, and in that pod there will be a single container
In that container in the pod, we are going to run a simple
pingcommand
Running our first containers on Kubernetes
First things first: we cannot run a container
We are going to run a pod, and in that pod there will be a single container
In that container in the pod, we are going to run a simple
pingcommandSounds simple enough, right?
Running our first containers on Kubernetes
First things first: we cannot run a container
We are going to run a pod, and in that pod there will be a single container
In that container in the pod, we are going to run a simple
pingcommandSounds simple enough, right?
Except ... that the
kubectl runcommand changed in Kubernetes 1.18!We'll explain what has changed, and why
Choose your own adventure
- First, let's check which version of Kubernetes we're running
Check our API server version:
kubectl versionLook at the Server Version in the second part of the output
In the following slides, we will talk about 1.17- or 1.18+
(to indicate "up to Kubernetes 1.17" and "from Kubernetes 1.18")
Starting a simple pod with kubectl run
kubectl runis convenient to start a single podWe need to specify at least a name and the image we want to use
Optionally, we can specify the command to run in the pod
- Let's ping the address of
localhost, the loopback interface:kubectl run pingpong --image alpine ping 127.0.0.1
What do we see?
In Kubernetes 1.18+, the output tells us that a Pod is created:
pod/pingpong createdIn Kubernetes 1.17-, the output is much more verbose:
kubectl run --generator=deployment/apps.v1 is DEPRECATEDand will be removed in a future version. Use kubectl run--generator=run-pod/v1 or kubectl create instead.deployment.apps/pingpong createdThere is a deprecation warning ...
... And a Deployment was created instead of a Pod
🤔 What does that mean?
Show me all you got!
- What resources were created by
kubectl run?
- Let's ask Kubernetes to show us all the resources:kubectl get all
Note: kubectl get all is a lie. It doesn't show everything.
(But it shows a lot of "usual suspects", i.e. commonly used resources.)
The situation with Kubernetes 1.18+
NAME READY STATUS RESTARTS AGEpod/pingpong 1/1 Running 0 9sNAME TYPE CLUSTER-IP EXTERNAL-IP PORT(S) AGEservice/kubernetes ClusterIP 10.96.0.1 <none> 443/TCP 3h30mWe wanted a pod, we got a pod, named pingpong. Great!
(We can ignore service/kubernetes, it was already there before.)
The situation with Kubernetes 1.17-
NAME READY STATUS RESTARTS AGEpod/pingpong-6ccbc77f68-kmgfn 1/1 Running 0 11sNAME TYPE CLUSTER-IP EXTERNAL-IP PORT(S) AGEservice/kubernetes ClusterIP 10.96.0.1 <none> 443/TCP 3h45NAME READY UP-TO-DATE AVAILABLE AGEdeployment.apps/pingpong 1/1 1 1 11sNAME DESIRED CURRENT READY AGEreplicaset.apps/pingpong-6ccbc77f68 1 1 1 11sOur pod is not named pingpong, but pingpong-xxxxxxxxxxx-yyyyy.
We have a Deployment named pingpong, and an extra Replica Set, too. What's going on?
From Deployment to Pod
We have the following resources:
deployment.apps/pingpongThis is the Deployment that we just created.
replicaset.apps/pingpong-xxxxxxxxxxThis is a Replica Set created by this Deployment.
pod/pingpong-xxxxxxxxxx-yyyyyThis is a pod created by the Replica Set.
Let's explain what these things are.
Pod
Can have one or multiple containers
Runs on a single node
(Pod cannot "straddle" multiple nodes)
Pods cannot be moved
(e.g. in case of node outage)
Pods cannot be scaled
(except by manually creating more Pods)
Pod details
A Pod is not a process; it's an environment for containers
it cannot be "restarted"
it cannot "crash"
The containers in a Pod can crash
They may or may not get restarted
(depending on Pod's restart policy)
If all containers exit successfully, the Pod ends in "Succeeded" phase
If some containers fail and don't get restarted, the Pod ends in "Failed" phase
Replica Set
Set of identical (replicated) Pods
Defined by a pod template + number of desired replicas
If there are not enough Pods, the Replica Set creates more
(e.g. in case of node outage; or simply when scaling up)
If there are too many Pods, the Replica Set deletes some
(e.g. if a node was disconnected and comes back; or when scaling down)
We can scale up/down a Replica Set
we update the manifest of the Replica Set
as a consequence, the Replica Set controller creates/deletes Pods
Deployment
Replica Sets control identical Pods
Deployments are used to roll out different Pods
(different image, command, environment variables, ...)
When we update a Deployment with a new Pod definition:
a new Replica Set is created with the new Pod definition
that new Replica Set is progressively scaled up
meanwhile, the old Replica Set(s) is(are) scaled down
This is a rolling update, minimizing application downtime
When we scale up/down a Deployment, it scales up/down its Replica Set
kubectl run through the ages
When we want to run an app on Kubernetes, we generally want a Deployment
Up to Kubernetes 1.17,
kubectl runcreated a Deploymentit could also create other things, by using special flags
this was powerful, but potentially confusing
creating a single Pod was done with
kubectl run --restart=Neverother resources could also be created with
kubectl create ...
From Kubernetes 1.18,
kubectl runcreates a Pod- other kinds of resources can still be created with
kubectl create
- other kinds of resources can still be created with
Creating a Deployment the proper way
Let's destroy that
pingpongapp that we createdThen we will use
kubectl create deploymentto re-create it
On Kubernetes 1.18+, delete the Pod named
pingpong:kubectl delete pod pingpongOn Kubernetes 1.17-, delete the Deployment named
pingpong:kubectl delete deployment pingpong
Running ping in a Deployment
When using
kubectl create deployment, we cannot indicate the command to execute(at least, not in Kubernetes 1.18; but that changed in Kubernetes 1.19)
We can:
- write a custom YAML manifest for our Deployment
Running ping in a Deployment
When using
kubectl create deployment, we cannot indicate the command to execute(at least, not in Kubernetes 1.18; but that changed in Kubernetes 1.19)
We can:
write a custom YAML manifest for our Deployment
(yeah right ... too soon!)
Running ping in a Deployment
When using
kubectl create deployment, we cannot indicate the command to execute(at least, not in Kubernetes 1.18; but that changed in Kubernetes 1.19)
We can:
write a custom YAML manifest for our Deployment
(yeah right ... too soon!)
use an image that has the command to execute baked in
(much easier!)
We will use the image
jpetazzo/ping(it has a default command of
ping 127.0.0.1)
Creating a Deployment running ping
Let's create a Deployment named
pingpongIt will use the image
jpetazzo/ping
Create the Deployment:
kubectl create deployment pingpong --image=jpetazzo/pingCheck the resources that were created:
kubectl get all
In Kubernetes 1.19
Since Kubernetes 1.19, we can specify the command to run
The command must be passed after two dashes:
kubectl create deployment pingpong --image=alpine -- ping 127.1
Viewing container output
Let's use the
kubectl logscommandWe will pass either a pod name, or a type/name
(E.g. if we specify a deployment or replica set, it will get the first pod in it)
Unless specified otherwise, it will only show logs of the first container in the pod
(Good thing there's only one in ours!)
- View the result of our
pingcommand:kubectl logs deploy/pingpong
Streaming logs in real time
Just like
docker logs,kubectl logssupports convenient options:-f/--followto stream logs in real time (à latail -f)--tailto indicate how many lines you want to see (from the end)--sinceto get logs only after a given timestamp
View the latest logs of our
pingcommand:kubectl logs deploy/pingpong --tail 1 --followStop it with Ctrl-C
Scaling our application
- We can create additional copies of our container (I mean, our pod) with
kubectl scale
Scale our
pingpongdeployment:kubectl scale deploy/pingpong --replicas 3Note that this command does exactly the same thing:
kubectl scale deployment pingpong --replicas 3Check that we now have multiple pods:
kubectl get pods
Scaling a Replica Set
What if we scale the Replica Set instead of the Deployment?
The Deployment would notice it right away and scale back to the initial level
The Replica Set makes sure that we have the right numbers of Pods
The Deployment makes sure that the Replica Set has the right size
(conceptually, it delegates the management of the Pods to the Replica Set)
This might seem weird (why this extra layer?) but will soon make sense
(when we will look at how rolling updates work!)
Streaming logs of multiple pods
- What happens if we try
kubectl logsnow that we have multiple pods?
kubectl logs deploy/pingpong --tail 3kubectl logs will warn us that multiple pods were found.
It is showing us only one of them.
We'll see later how to address that shortcoming.
Resilience
The deployment
pingpongwatches its replica setThe replica set ensures that the right number of pods are running
What happens if pods disappear?
- In a separate window, watch the list of pods:watch kubectl get pods
- Destroy the pod currently shown by
kubectl logs:kubectl delete pod pingpong-xxxxxxxxxx-yyyyy
What happened?
kubectl delete podterminates the pod gracefully(sending it the TERM signal and waiting for it to shutdown)
As soon as the pod is in "Terminating" state, the Replica Set replaces it
But we can still see the output of the "Terminating" pod in
kubectl logsUntil 30 seconds later, when the grace period expires
The pod is then killed, and
kubectl logsexits
:EN:- Running pods and deployments :FR:- Créer un pod et un déploiement

Executing batch jobs
(automatically generated title slide)
Executing batch jobs
Deployments are great for stateless web apps
(as well as workers that keep running forever)
Pods are great for one-off execution that we don't care about
(because they don't get automatically restarted if something goes wrong)
Jobs are great for "long" background work
("long" being at least minutes or hours)
CronJobs are great to schedule Jobs at regular intervals
(just like the classic UNIX
crondaemon with itscrontabfiles)
Creating a Job
A Job will create a Pod
If the Pod fails, the Job will create another one
The Job will keep trying until:
either a Pod succeeds,
or we hit the backoff limit of the Job (default=6)
- Create a Job that has a 50% chance of success:kubectl create job flipcoin --image=alpine -- sh -c 'exit $(($RANDOM%2))'
Our Job in action
Our Job will create a Pod named
flipcoin-xxxxxIf the Pod succeeds, the Job stops
If the Pod fails, the Job creates another Pod
- Check the status of the Pod(s) created by the Job:kubectl get pods --selector=job-name=flipcoin
More advanced jobs
We can specify a number of "completions" (default=1)
This indicates how many times the Job must be executed
We can specify the "parallelism" (default=1)
This indicates how many Pods should be running in parallel
These options cannot be specified with
kubectl create job(we have to write our own YAML manifest to use them)
Scheduling periodic background work
A Cron Job is a Job that will be executed at specific intervals
(the name comes from the traditional cronjobs executed by the UNIX crond)
It requires a schedule, represented as five space-separated fields:
- minute [0,59]
- hour [0,23]
- day of the month [1,31]
- month of the year [1,12]
- day of the week ([0,6] with 0=Sunday)
*means "all valid values";/Nmeans "every N"Example:
*/3 * * * *means "every three minutes"
Creating a Cron Job
Let's create a simple job to be executed every three minutes
Careful: make sure that the job terminates!
(The Cron Job will not hold if a previous job is still running)
Create the Cron Job:
kubectl create cronjob every3mins --schedule="*/3 * * * *" \--image=alpine -- sleep 10Check the resource that was created:
kubectl get cronjobs
Cron Jobs in action
At the specified schedule, the Cron Job will create a Job
The Job will create a Pod
The Job will make sure that the Pod completes
(re-creating another one if it fails, for instance if its node fails)
- Check the Jobs that are created:kubectl get jobs
(It will take a few minutes before the first job is scheduled.)
Setting a time limit
It is possible to set a time limit (or deadline) for a job
This is done with the field
spec.activeDeadlineSeconds(by default, it is unlimited)
When the job is older than this time limit, all its pods are terminated
Note that there can also be a
spec.activeDeadlineSecondsfield in pods!They can be set independently, and have different effects:
the deadline of the job will stop the entire job
the deadline of the pod will only stop an individual pod
What about kubectl run before v1.18?
Creating a Deployment:
kubectl runCreating a Pod:
kubectl run --restart=NeverCreating a Job:
kubectl run --restart=OnFailureCreating a Cron Job:
kubectl run --restart=OnFailure --schedule=...
Avoid using these forms, as they are deprecated since Kubernetes 1.18!
Beyond kubectl create
As hinted earlier,
kubectl createdoesn't always expose all optionscan't express parallelism or completions of Jobs
can't express healthchecks, resource limits
kubectl createandkubectl runare helpers that generate YAML manifestsIf we write these manifests ourselves, we can use all features and options
We'll see later how to do that!
:EN:- Running batch and cron jobs :FR:- Tâches périodiques (cron) et traitement par lots (batch)

Labels and annotations
(automatically generated title slide)
Labels and annotations
Most Kubernetes resources can have labels and annotations
Both labels and annotations are arbitrary strings
(with some limitations that we'll explain in a minute)
Both labels and annotations can be added, removed, changed, dynamically
This can be done with:
the
kubectl editcommandthe
kubectl labelandkubectl annotate... many other ways! (
kubectl apply -f,kubectl patch, ...)
Viewing labels and annotations
- Let's see what we get when we create a Deployment
Create a Deployment:
kubectl create deployment clock --image=jpetazzo/clockLook at its annotations and labels:
kubectl describe deployment clock
So, what do we get?
Labels and annotations for our Deployment
We see one label:
Labels: app=clockThis is added by
kubectl create deploymentAnd one annotation:
Annotations: deployment.kubernetes.io/revision: 1This is to keep track of successive versions when doing rolling updates
And for the related Pod?
- Let's look up the Pod that was created and check it too
Find the name of the Pod:
kubectl get podsDisplay its information:
kubectl describe pod clock-xxxxxxxxxx-yyyyy
So, what do we get?
Labels and annotations for our Pod
We see two labels:
Labels: app=clockpod-template-hash=xxxxxxxxxxapp=clockcomes fromkubectl create deploymenttoopod-template-hashwas assigned by the Replica Set(when we will do rolling updates, each set of Pods will have a different hash)
There are no annotations:
Annotations: <none>
Selectors
A selector is an expression matching labels
It will restrict a command to the objects matching at least all these labels
List all the pods with at least
app=clock:kubectl get pods --selector=app=clockList all the pods with a label
app, regardless of its value:kubectl get pods --selector=app
Settings labels and annotations
- The easiest method is to use
kubectl labelandkubectl annotate
Set a label on the
clockDeployment:kubectl label deployment clock color=blueCheck it out:
kubectl describe deployment clock
Other ways to view labels
kubectl getgives us a couple of useful flags to check labelskubectl get --show-labelsshows all labelskubectl get -L xyzshows the value of labelxyz
List all the labels that we have on pods:
kubectl get pods --show-labelsList the value of label
appon these pods:kubectl get pods -L app
More on selectors
If a selector has multiple labels, it means "match at least these labels"
Example:
--selector=app=frontend,release=prod--selectorcan be abbreviated as-l(for labels)We can also use negative selectors
Example:
--selector=app!=clockSelectors can be used with most
kubectlcommandsExamples:
kubectl delete,kubectl label, ...
Other ways to view labels
- We can use the
--show-labelsflag withkubectl get
- Show labels for a bunch of objects:kubectl get --show-labels po,rs,deploy,svc,no
Differences between labels and annotations
The key for both labels and annotations:
must start and end with a letter or digit
can also have
.-_(but not in first or last position)can be up to 63 characters, or 253 +
/+ 63
Label values are up to 63 characters, with the same restrictions
Annotations values can have arbitrary characters (yes, even binary)
Maximum length isn't defined
(dozens of kilobytes is fine, hundreds maybe not so much)
:EN:- Labels and annotations :FR:- Labels et annotations

Revisiting kubectl logs
(automatically generated title slide)
Revisiting kubectl logs
In this section, we assume that we have a Deployment with multiple Pods
(e.g.
pingpongthat we scaled to at least 3 pods)We will highlights some of the limitations of
kubectl logs
Streaming logs of multiple pods
- By default,
kubectl logsshows us the output of a single Pod
- Try to check the output of the Pods related to a Deployment:kubectl logs deploy/pingpong --tail 1 --follow
kubectl logs only shows us the logs of one of the Pods.
Viewing logs of multiple pods
When we specify a deployment name, only one single pod's logs are shown
We can view the logs of multiple pods by specifying a selector
If we check the pods created by the deployment, they all have the label
app=pingpong(this is just a default label that gets added when using
kubectl create deployment)
- View the last line of log from all pods with the
app=pingponglabel:kubectl logs -l app=pingpong --tail 1
Streaming logs of multiple pods
- Can we stream the logs of all our
pingpongpods?
- Combine
-land-fflags:kubectl logs -l app=pingpong --tail 1 -f
Note: combining -l and -f is only possible since Kubernetes 1.14!
Let's try to understand why ...
Streaming logs of many pods
- Let's see what happens if we try to stream the logs for more than 5 pods
Scale up our deployment:
kubectl scale deployment pingpong --replicas=8Stream the logs:
kubectl logs -l app=pingpong --tail 1 -f
We see a message like the following one:
error: you are attempting to follow 8 log streams,but maximum allowed concurency is 5,use --max-log-requests to increase the limitWhy can't we stream the logs of many pods?
kubectlopens one connection to the API server per podFor each pod, the API server opens one extra connection to the corresponding kubelet
If there are 1000 pods in our deployment, that's 1000 inbound + 1000 outbound connections on the API server
This could easily put a lot of stress on the API server
Prior Kubernetes 1.14, it was decided to not allow multiple connections
From Kubernetes 1.14, it is allowed, but limited to 5 connections
(this can be changed with
--max-log-requests)For more details about the rationale, see PR #67573
Shortcomings of kubectl logs
We don't see which pod sent which log line
If pods are restarted / replaced, the log stream stops
If new pods are added, we don't see their logs
To stream the logs of multiple pods, we need to write a selector
There are external tools to address these shortcomings
(e.g.: Stern)
kubectl logs -l ... --tail N
If we run this with Kubernetes 1.12, the last command shows multiple lines
This is a regression when
--tailis used together with-l/--selectorIt always shows the last 10 lines of output for each container
(instead of the number of lines specified on the command line)
The problem was fixed in Kubernetes 1.13
See #70554 for details.
:EN:- Viewing logs with "kubectl logs" :FR:- Consulter les logs avec "kubectl logs"

Accessing logs from the CLI
(automatically generated title slide)
Accessing logs from the CLI
The
kubectl logscommand has limitations:it cannot stream logs from multiple pods at a time
when showing logs from multiple pods, it mixes them all together
We are going to see how to do it better
Doing it manually
We could (if we were so inclined) write a program or script that would:
take a selector as an argument
enumerate all pods matching that selector (with
kubectl get -l ...)fork one
kubectl logs --follow ...command per containerannotate the logs (the output of each
kubectl logs ...process) with their originpreserve ordering by using
kubectl logs --timestamps ...and merge the output
We could do it, but thankfully, others did it for us already!
Stern
Stern is an open source project by Wercker.
From the README:
Stern allows you to tail multiple pods on Kubernetes and multiple containers within the pod. Each result is color coded for quicker debugging.
The query is a regular expression so the pod name can easily be filtered and you don't need to specify the exact id (for instance omitting the deployment id). If a pod is deleted it gets removed from tail and if a new pod is added it automatically gets tailed.
Exactly what we need!
Checking if Stern is installed
Run
stern(without arguments) to check if it's installed:$ sternTail multiple pods and containers from KubernetesUsage:stern pod-query [flags]If it's missing, let's see how to install it
Installing Stern
Stern is written in Go, and Go programs are usually shipped as a single binary
We just need to download that binary and put it in our
PATH!Binary releases are available here on GitHub
The following commands will install Stern on a Linux Intel 64 bit machine:
sudo curl -L -o /usr/local/bin/stern \https://github.com/wercker/stern/releases/download/1.11.0/stern_linux_amd64sudo chmod +x /usr/local/bin/sternOn macOS, we can also
brew install sternorsudo port install stern
Using Stern
There are two ways to specify the pods whose logs we want to see:
-lfollowed by a selector expression (like with manykubectlcommands)with a "pod query," i.e. a regex used to match pod names
These two ways can be combined if necessary
- View the logs for all the pingpong containers:stern pingpong
Stern convenient options
The
--tail Nflag shows the lastNlines for each container(Instead of showing the logs since the creation of the container)
The
-t/--timestampsflag shows timestampsThe
--all-namespacesflag is self-explanatory
- View what's up with the
weavesystem containers:stern --tail 1 --timestamps --all-namespaces weave
Using Stern with a selector
When specifying a selector, we can omit the value for a label
This will match all objects having that label (regardless of the value)
Everything created with
kubectl runhas a labelrunEverything created with
kubectl create deploymenthas a labelappWe can use that property to view the logs of all the pods created with
kubectl create deployment
- View the logs for all the things started with
kubectl create deployment:stern -l app
:EN:- Viewing pod logs from the CLI :FR:- Consulter les logs des pods depuis la CLI

Declarative vs imperative
(automatically generated title slide)
Declarative vs imperative
Our container orchestrator puts a very strong emphasis on being declarative
Declarative:
I would like a cup of tea.
Imperative:
Boil some water. Pour it in a teapot. Add tea leaves. Steep for a while. Serve in a cup.
Declarative vs imperative
Our container orchestrator puts a very strong emphasis on being declarative
Declarative:
I would like a cup of tea.
Imperative:
Boil some water. Pour it in a teapot. Add tea leaves. Steep for a while. Serve in a cup.
Declarative seems simpler at first ...
Declarative vs imperative
Our container orchestrator puts a very strong emphasis on being declarative
Declarative:
I would like a cup of tea.
Imperative:
Boil some water. Pour it in a teapot. Add tea leaves. Steep for a while. Serve in a cup.
Declarative seems simpler at first ...
... As long as you know how to brew tea
Declarative vs imperative
What declarative would really be:
I want a cup of tea, obtained by pouring an infusion¹ of tea leaves in a cup.
Declarative vs imperative
What declarative would really be:
I want a cup of tea, obtained by pouring an infusion¹ of tea leaves in a cup.
¹An infusion is obtained by letting the object steep a few minutes in hot² water.
Declarative vs imperative
What declarative would really be:
I want a cup of tea, obtained by pouring an infusion¹ of tea leaves in a cup.
¹An infusion is obtained by letting the object steep a few minutes in hot² water.
²Hot liquid is obtained by pouring it in an appropriate container³ and setting it on a stove.
³Ah, finally, containers! Something we know about. Let's get to work, shall we?
Did you know there was an ISO standard specifying how to brew tea?
Declarative vs imperative
Imperative systems:
simpler
if a task is interrupted, we have to restart from scratch
Declarative systems:
if a task is interrupted (or if we show up to the party half-way through), we can figure out what's missing and do only what's necessary
we need to be able to observe the system
... and compute a "diff" between what we have and what we want
Declarative vs imperative in Kubernetes
With Kubernetes, we cannot say: "run this container"
All we can do is write a spec and push it to the API server
(by creating a resource like e.g. a Pod or a Deployment)
The API server will validate that spec (and reject it if it's invalid)
Then it will store it in etcd
A controller will "notice" that spec and act upon it
Reconciling state
Watch for the
specfields in the YAML files later!The spec describes how we want the thing to be
Kubernetes will reconcile the current state with the spec
(technically, this is done by a number of controllers)When we want to change some resource, we update the spec
Kubernetes will then converge that resource
:EN:- Declarative vs imperative models :FR:- Modèles déclaratifs et impératifs
19,000 words
They say, "a picture is worth one thousand words."
The following 19 slides show what really happens when we run:
kubectl create deployment web --image=nginx


Kubernetes network model
(automatically generated title slide)
Kubernetes network model
TL,DR:
Our cluster (nodes and pods) is one big flat IP network.
Kubernetes network model
TL,DR:
Our cluster (nodes and pods) is one big flat IP network.
In detail:
all nodes must be able to reach each other, without NAT
all pods must be able to reach each other, without NAT
pods and nodes must be able to reach each other, without NAT
each pod is aware of its IP address (no NAT)
pod IP addresses are assigned by the network implementation
Kubernetes doesn't mandate any particular implementation
Kubernetes network model: the good
Everything can reach everything
No address translation
No port translation
No new protocol
The network implementation can decide how to allocate addresses
IP addresses don't have to be "portable" from a node to another
(We can use e.g. a subnet per node and use a simple routed topology)
The specification is simple enough to allow many various implementations
Kubernetes network model: the less good
Everything can reach everything
if you want security, you need to add network policies
the network implementation that you use needs to support them
There are literally dozens of implementations out there
(https://github.com/containernetworking/cni/ lists more than 25 plugins)
Pods have level 3 (IP) connectivity, but services are level 4 (TCP or UDP)
(Services map to a single UDP or TCP port; no port ranges or arbitrary IP packets)
kube-proxyis on the data path when connecting to a pod or container,
and it's not particularly fast (relies on userland proxying or iptables)
Kubernetes network model: in practice
The nodes that we are using have been set up to use Weave
We don't endorse Weave in a particular way, it just Works For Us
Don't worry about the warning about
kube-proxyperformanceUnless you:
- routinely saturate 10G network interfaces
- count packet rates in millions per second
- run high-traffic VOIP or gaming platforms
- do weird things that involve millions of simultaneous connections
(in which case you're already familiar with kernel tuning)
If necessary, there are alternatives to
kube-proxy; e.g.kube-router
The Container Network Interface (CNI)
Most Kubernetes clusters use CNI "plugins" to implement networking
When a pod is created, Kubernetes delegates the network setup to these plugins
(it can be a single plugin, or a combination of plugins, each doing one task)
Typically, CNI plugins will:
allocate an IP address (by calling an IPAM plugin)
add a network interface into the pod's network namespace
configure the interface as well as required routes etc.
Multiple moving parts
The "pod-to-pod network" or "pod network":
provides communication between pods and nodes
is generally implemented with CNI plugins
The "pod-to-service network":
provides internal communication and load balancing
is generally implemented with kube-proxy (or e.g. kube-router)
Network policies:
provide firewalling and isolation
can be bundled with the "pod network" or provided by another component


Even more moving parts
Inbound traffic can be handled by multiple components:
something like kube-proxy or kube-router (for NodePort services)
load balancers (ideally, connected to the pod network)
It is possible to use multiple pod networks in parallel
(with "meta-plugins" like CNI-Genie or Multus)
Some solutions can fill multiple roles
(e.g. kube-router can be set up to provide the pod network and/or network policies and/or replace kube-proxy)
:EN:- The Kubernetes network model :FR:- Le modèle réseau de Kubernetes

Exposing containers
(automatically generated title slide)
Exposing containers
We can connect to our pods using their IP address
Then we need to figure out a lot of things:
how do we look up the IP address of the pod(s)?
how do we connect from outside the cluster?
how do we load balance traffic?
what if a pod fails?
Kubernetes has a resource type named Service
Services address all these questions!
Services in a nutshell
Services give us a stable endpoint to connect to a pod or a group of pods
An easy way to create a service is to use
kubectl exposeIf we have a deployment named
my-little-deploy, we can run:kubectl expose deployment my-little-deploy --port=80... and this will create a service with the same name (
my-little-deploy)Services are automatically added to an internal DNS zone
(in the example above, our code can now connect to http://my-little-deploy/)
Advantages of services
We don't need to look up the IP address of the pod(s)
(we resolve the IP address of the service using DNS)
There are multiple service types; some of them allow external traffic
(e.g.
LoadBalancerandNodePort)Services provide load balancing
(for both internal and external traffic)
Service addresses are independent from pods' addresses
(when a pod fails, the service seamlessly sends traffic to its replacement)
Many kinds and flavors of service
There are different types of services:
ClusterIP,NodePort,LoadBalancer,ExternalNameThere are also headless services
Services can also have optional external IPs
There is also another resource type called Ingress
(specifically for HTTP services)
Wow, that's a lot! Let's start with the basics ...
ClusterIP
It's the default service type
A virtual IP address is allocated for the service
(in an internal, private range; e.g. 10.96.0.0/12)
This IP address is reachable only from within the cluster (nodes and pods)
Our code can connect to the service using the original port number
Perfect for internal communication, within the cluster
LoadBalancer
An external load balancer is allocated for the service
(typically a cloud load balancer, e.g. ELB on AWS, GLB on GCE ...)
This is available only when the underlying infrastructure provides some kind of "load balancer as a service"
Each service of that type will typically cost a little bit of money
(e.g. a few cents per hour on AWS or GCE)
Ideally, traffic would flow directly from the load balancer to the pods
In practice, it will often flow through a
NodePortfirst
NodePort
A port number is allocated for the service
(by default, in the 30000-32767 range)
That port is made available on all our nodes and anybody can connect to it
(we can connect to any node on that port to reach the service)
Our code needs to be changed to connect to that new port number
Under the hood:
kube-proxysets up a bunch ofiptablesrules on our nodesSometimes, it's the only available option for external traffic
(e.g. most clusters deployed with kubeadm or on-premises)
Running containers with open ports
Since
pingdoesn't have anything to connect to, we'll have to run something elseWe could use the
nginxofficial image, but ...... we wouldn't be able to tell the backends from each other!
We are going to use
jpetazzo/httpenv, a tiny HTTP server written in Gojpetazzo/httpenvlistens on port 8888It serves its environment variables in JSON format
The environment variables will include
HOSTNAME, which will be the pod name(and therefore, will be different on each backend)
Supporting other CPU architectures
The
jpetazzo/httpenvimage is currently only available forx86_64(the "classic" Intel 64 bits architecture found on most PCs and Macs)
That image won't work on other architectures
(e.g. Raspberry Pi or other ARM-based machines)
Note that Docker supports multi-arch images
(so technically we could make it work across multiple architectures)
If you want to build
httpenvfor your own platform, here is the source:
Creating a deployment for our HTTP server
We will create a deployment with
kubectl create deploymentThen we will scale it with
kubectl scale
- In another window, watch the pods (to see when they are created):kubectl get pods -w
Create a deployment for this very lightweight HTTP server:
kubectl create deployment httpenv --image=jpetazzo/httpenvScale it to 10 replicas:
kubectl scale deployment httpenv --replicas=10
Exposing our deployment
- We'll create a default
ClusterIPservice
Expose the HTTP port of our server:
kubectl expose deployment httpenv --port 8888Look up which IP address was allocated:
kubectl get service
Services are layer 4 constructs
You can assign IP addresses to services, but they are still layer 4
(i.e. a service is not an IP address; it's an IP address + protocol + port)
This is caused by the current implementation of
kube-proxy(it relies on mechanisms that don't support layer 3)
As a result: you have to indicate the port number for your service
(with some exceptions, like
ExternalNameor headless services, covered later)
Testing our service
- We will now send a few HTTP requests to our pods
- Let's obtain the IP address that was allocated for our service, programmatically:IP=$(kubectl get svc httpenv -o go-template --template '{{ .spec.clusterIP }}')
Send a few requests:
curl http://$IP:8888/Too much output? Filter it with
jq:curl -s http://$IP:8888/ | jq .HOSTNAME
Try it a few times! Our requests are load balanced across multiple pods.
ExternalName
Services of type
ExternalNameare quite differentNo load balancer (internal or external) is created
Only a DNS entry gets added to the DNS managed by Kubernetes
That DNS entry will just be a
CNAMEto a provided record
Example:
kubectl create service externalname k8s --external-name kubernetes.ioCreates a CNAME k8s pointing to kubernetes.io
External IPs
We can add an External IP to a service, e.g.:
kubectl expose deploy my-little-deploy --port=80 --external-ip=1.2.3.41.2.3.4should be the address of one of our nodes(it could also be a virtual address, service address, or VIP, shared by multiple nodes)
Connections to
1.2.3.4:80will be sent to our serviceExternal IPs will also show up on services of type
LoadBalancer(they will be added automatically by the process provisioning the load balancer)
Headless services
Sometimes, we want to access our scaled services directly:
if we want to save a tiny little bit of latency (typically less than 1ms)
if we need to connect over arbitrary ports (instead of a few fixed ones)
if we need to communicate over another protocol than UDP or TCP
if we want to decide how to balance the requests client-side
...
In that case, we can use a "headless service"
Creating a headless services
A headless service is obtained by setting the
clusterIPfield toNone(Either with
--cluster-ip=None, or by providing a custom YAML)As a result, the service doesn't have a virtual IP address
Since there is no virtual IP address, there is no load balancer either
CoreDNS will return the pods' IP addresses as multiple
ArecordsThis gives us an easy way to discover all the replicas for a deployment
Services and endpoints
A service has a number of "endpoints"
Each endpoint is a host + port where the service is available
The endpoints are maintained and updated automatically by Kubernetes
- Check the endpoints that Kubernetes has associated with our
httpenvservice:kubectl describe service httpenv
In the output, there will be a line starting with Endpoints:.
That line will list a bunch of addresses in host:port format.
Viewing endpoint details
When we have many endpoints, our display commands truncate the list
kubectl get endpointsIf we want to see the full list, we can use one of the following commands:
kubectl describe endpoints httpenvkubectl get endpoints httpenv -o yamlThese commands will show us a list of IP addresses
These IP addresses should match the addresses of the corresponding pods:
kubectl get pods -l app=httpenv -o wide
endpoints not endpoint
endpointsis the only resource that cannot be singular
$ kubectl get endpointerror: the server doesn't have a resource type "endpoint"This is because the type itself is plural (unlike every other resource)
There is no
endpointobject:type Endpoints structThe type doesn't represent a single endpoint, but a list of endpoints
The DNS zone
In the
kube-systemnamespace, there should be a service namedkube-dnsThis is the internal DNS server that can resolve service names
The default domain name for the service we created is
default.svc.cluster.local
Get the IP address of the internal DNS server:
IP=$(kubectl -n kube-system get svc kube-dns -o jsonpath={.spec.clusterIP})Resolve the cluster IP for the
httpenvservice:host httpenv.default.svc.cluster.local $IP
Ingress
Ingresses are another type (kind) of resource
They are specifically for HTTP services
(not TCP or UDP)
They can also handle TLS certificates, URL rewriting ...
They require an Ingress Controller to function
:EN:- Service discovery and load balancing :EN:- Accessing pods through services :EN:- Service types: ClusterIP, NodePort, LoadBalancer
:FR:- Exposer un service :FR:- Différents types de services : ClusterIP, NodePort, LoadBalancer :FR:- Utiliser CoreDNS pour la service discovery

Shipping images with a registry
(automatically generated title slide)
Shipping images with a registry
Initially, our app was running on a single node
We could build and run in the same place
Therefore, we did not need to ship anything
Now that we want to run on a cluster, things are different
The easiest way to ship container images is to use a registry
How Docker registries work (a reminder)
What happens when we execute
docker run alpine?If the Engine needs to pull the
alpineimage, it expands it intolibrary/alpinelibrary/alpineis expanded intoindex.docker.io/library/alpineThe Engine communicates with
index.docker.ioto retrievelibrary/alpine:latestTo use something else than
index.docker.io, we specify it in the image nameExamples:
docker pull gcr.io/google-containers/alpine-with-bash:1.0docker build -t registry.mycompany.io:5000/myimage:awesome .docker push registry.mycompany.io:5000/myimage:awesome
Running DockerCoins on Kubernetes
Create one deployment for each component
(hasher, redis, rng, webui, worker)
Expose deployments that need to accept connections
(hasher, redis, rng, webui)
For redis, we can use the official redis image
For the 4 others, we need to build images and push them to some registry
Building and shipping images
There are many options!
Manually:
build locally (with
docker buildor otherwise)push to the registry
Automatically:
build and test locally
when ready, commit and push a code repository
the code repository notifies an automated build system
that system gets the code, builds it, pushes the image to the registry
Which registry do we want to use?
There are SAAS products like Docker Hub, Quay ...
Each major cloud provider has an option as well
(ACR on Azure, ECR on AWS, GCR on Google Cloud...)
There are also commercial products to run our own registry
(Docker EE, Quay...)
And open source options, too!
When picking a registry, pay attention to its build system
(when it has one)
Building on the fly
Conceptually, it is possible to build images on the fly from a repository
Example: ctr.run
(deprecated in August 2020, after being aquired by Datadog)
It did allow something like this:
docker run ctr.run/github.com/jpetazzo/container.training/dockercoins/hasherNo alternative yet
(free startup idea, anyone?)
:EN:- Shipping images to Kubernetes :FR:- Déployer des images sur notre cluster
Self-hosting our registry
Note: this section shows how to run the Docker open source registry and use it to ship images on our cluster. While this method works fine, we recommend that you consider using one of the hosted, free automated build services instead. It will be much easier!
If you need to run a registry on premises, this section gives you a starting point, but you will need to make a lot of changes so that the registry is secured, highly available, and so that your build pipeline is automated.
k8s/buildshiprun-selfhosted.md
Using the open source registry
We need to run a
registrycontainerIt will store images and layers to the local filesystem
(but you can add a config file to use S3, Swift, etc.)Docker requires TLS when communicating with the registry
unless for registries on
127.0.0.0/8(i.e.localhost)or with the Engine flag
--insecure-registry
Our strategy: publish the registry container on a NodePort,
so that it's available through127.0.0.1:xxxxxon each node
k8s/buildshiprun-selfhosted.md
Deploying a self-hosted registry
- We will deploy a registry container, and expose it with a NodePort
Create the registry service:
kubectl create deployment registry --image=registryExpose it on a NodePort:
kubectl expose deploy/registry --port=5000 --type=NodePort
k8s/buildshiprun-selfhosted.md
Connecting to our registry
- We need to find out which port has been allocated
View the service details:
kubectl describe svc/registryGet the port number programmatically:
NODEPORT=$(kubectl get svc/registry -o json | jq .spec.ports[0].nodePort)REGISTRY=127.0.0.1:$NODEPORT
k8s/buildshiprun-selfhosted.md
Testing our registry
- A convenient Docker registry API route to remember is
/v2/_catalog
- View the repositories currently held in our registry:curl $REGISTRY/v2/_catalog
Testing our registry
- A convenient Docker registry API route to remember is
/v2/_catalog
- View the repositories currently held in our registry:curl $REGISTRY/v2/_catalog
We should see:
{"repositories":[]}k8s/buildshiprun-selfhosted.md
Testing our local registry
- We can retag a small image, and push it to the registry
Make sure we have the busybox image, and retag it:
docker pull busyboxdocker tag busybox $REGISTRY/busyboxPush it:
docker push $REGISTRY/busybox
k8s/buildshiprun-selfhosted.md
Checking again what's on our local registry
- Let's use the same endpoint as before
- Ensure that our busybox image is now in the local registry:curl $REGISTRY/v2/_catalog
The curl command should now output:
{"repositories":["busybox"]}k8s/buildshiprun-selfhosted.md
Building and pushing our images
- We are going to use a convenient feature of Docker Compose
Go to the
stacksdirectory:cd ~/container.training/stacksBuild and push the images:
export REGISTRYexport TAG=v0.1docker-compose -f dockercoins.yml builddocker-compose -f dockercoins.yml push
Let's have a look at the dockercoins.yml file while this is building and pushing.
k8s/buildshiprun-selfhosted.md
version: "3"services: rng: build: dockercoins/rng image: ${REGISTRY-127.0.0.1:5000}/rng:${TAG-latest} deploy: mode: global ... redis: image: redis ... worker: build: dockercoins/worker image: ${REGISTRY-127.0.0.1:5000}/worker:${TAG-latest} ... deploy: replicas: 10Just in case you were wondering ... Docker "services" are not Kubernetes "services".
k8s/buildshiprun-selfhosted.md
Avoiding the latest tag
Make sure that you've set the TAG variable properly!
If you don't, the tag will default to
latestThe problem with
latest: nobody knows what it points to!the latest commit in the repo?
the latest commit in some branch? (Which one?)
the latest tag?
some random version pushed by a random team member?
If you keep pushing the
latesttag, how do you roll back?Image tags should be meaningful, i.e. correspond to code branches, tags, or hashes
k8s/buildshiprun-selfhosted.md
Checking the content of the registry
- All our images should now be in the registry
- Re-run the same
curlcommand as earlier:curl $REGISTRY/v2/_catalog
In these slides, all the commands to deploy DockerCoins will use a $REGISTRY environment variable, so that we can quickly switch from the self-hosted registry to pre-built images hosted on the Docker Hub. So make sure that this $REGISTRY variable is set correctly when running the exercises! k8s/buildshiprun-selfhosted.md
Using images from the Docker Hub
For everyone's convenience, we took care of building DockerCoins images
We pushed these images to the DockerHub, under the dockercoins user
These images are tagged with a version number,
v0.1The full image names are therefore:
dockercoins/hasher:v0.1dockercoins/rng:v0.1dockercoins/webui:v0.1dockercoins/worker:v0.1

Running our application on Kubernetes
(automatically generated title slide)
Running our application on Kubernetes
- We can now deploy our code (as well as a redis instance)
Deploy
redis:kubectl create deployment redis --image=redisDeploy everything else:
kubectl create deployment hasher --image=dockercoins/hasher:v0.1kubectl create deployment rng --image=dockercoins/rng:v0.1kubectl create deployment webui --image=dockercoins/webui:v0.1kubectl create deployment worker --image=dockercoins/worker:v0.1
Deploying other images
If we wanted to deploy images from another registry ...
... Or with a different tag ...
... We could use the following snippet:
REGISTRY=dockercoins TAG=v0.1 for SERVICE in hasher rng webui worker; do kubectl create deployment $SERVICE --image=$REGISTRY/$SERVICE:$TAG doneIs this working?
After waiting for the deployment to complete, let's look at the logs!
(Hint: use
kubectl get deploy -wto watch deployment events)
- Look at some logs:kubectl logs deploy/rngkubectl logs deploy/worker
Is this working?
After waiting for the deployment to complete, let's look at the logs!
(Hint: use
kubectl get deploy -wto watch deployment events)
- Look at some logs:kubectl logs deploy/rngkubectl logs deploy/worker
🤔 rng is fine ... But not worker.
Is this working?
After waiting for the deployment to complete, let's look at the logs!
(Hint: use
kubectl get deploy -wto watch deployment events)
- Look at some logs:kubectl logs deploy/rngkubectl logs deploy/worker
🤔 rng is fine ... But not worker.
💡 Oh right! We forgot to expose.
Connecting containers together
Three deployments need to be reachable by others:
hasher,redis,rngworkerdoesn't need to be exposedwebuiwill be dealt with later
- Expose each deployment, specifying the right port:kubectl expose deployment redis --port 6379kubectl expose deployment rng --port 80kubectl expose deployment hasher --port 80
Is this working yet?
- The
workerhas an infinite loop, that retries 10 seconds after an error
Stream the worker's logs:
kubectl logs deploy/worker --follow(Give it about 10 seconds to recover)
Is this working yet?
- The
workerhas an infinite loop, that retries 10 seconds after an error
Stream the worker's logs:
kubectl logs deploy/worker --follow(Give it about 10 seconds to recover)
We should now see the worker, well, working happily.
Exposing services for external access
Now we would like to access the Web UI
We will expose it with a
NodePort(just like we did for the registry)
Create a
NodePortservice for the Web UI:kubectl expose deploy/webui --type=NodePort --port=80Check the port that was allocated:
kubectl get svc
Accessing the web UI
- We can now connect to any node, on the allocated node port, to view the web UI
- Open the web UI in your browser (http://node-ip-address:3xxxx/)
Accessing the web UI
- We can now connect to any node, on the allocated node port, to view the web UI
- Open the web UI in your browser (http://node-ip-address:3xxxx/)
Yes, this may take a little while to update. (Narrator: it was DNS.)
Accessing the web UI
- We can now connect to any node, on the allocated node port, to view the web UI
- Open the web UI in your browser (http://node-ip-address:3xxxx/)
Yes, this may take a little while to update. (Narrator: it was DNS.)
Alright, we're back to where we started, when we were running on a single node!
:EN:- Running our demo app on Kubernetes :FR:- Faire tourner l'application de démo sur Kubernetes

Deploying with YAML
(automatically generated title slide)
Deploying with YAML
So far, we created resources with the following commands:
kubectl runkubectl create deploymentkubectl expose
We can also create resources directly with YAML manifests
kubectl apply vs create
kubectl create -f whatever.yamlcreates resources if they don't exist
if resources already exist, don't alter them
(and display error message)
kubectl apply -f whatever.yamlcreates resources if they don't exist
if resources already exist, update them
(to match the definition provided by the YAML file)stores the manifest as an annotation in the resource
Creating multiple resources
- The manifest can contain multiple resources separated by
---
kind: ... apiVersion: ... metadata: ... name: ... ... --- kind: ... apiVersion: ... metadata: ... name: ... ...Creating multiple resources
- The manifest can also contain a list of resources
apiVersion: v1 kind: List items: - kind: ... apiVersion: ... ... - kind: ... apiVersion: ... ...Deploying dockercoins with YAML
We provide a YAML manifest with all the resources for Dockercoins
(Deployments and Services)
We can use it if we need to deploy or redeploy Dockercoins
- Deploy or redeploy Dockercoins:kubectl apply -f ~/container.training/k8s/dockercoins.yaml
(If we deployed Dockercoins earlier, we will see warning messages, because the resources that we created lack the necessary annotation. We can safely ignore them.)
Deleting resources
We can also use a YAML file to delete resources
kubectl delete -f ...will delete all the resources mentioned in a YAML file(useful to clean up everything that was created by
kubectl apply -f ...)The definitions of the resources don't matter
(just their
kind,apiVersion, andname)
Pruning¹ resources
We can also tell
kubectlto remove old resourcesThis is done with
kubectl apply -f ... --pruneIt will remove resources that don't exist in the YAML file(s)
But only if they were created with
kubectl applyin the first place(technically, if they have an annotation
kubectl.kubernetes.io/last-applied-configuration)
¹If English is not your first language: to prune means to remove dead or overgrown branches in a tree, to help it to grow.
YAML as source of truth
Imagine the following workflow:
do not use
kubectl run,kubectl create deployment,kubectl expose...define everything with YAML
kubectl apply -f ... --prune --allthat YAMLkeep that YAML under version control
enforce all changes to go through that YAML (e.g. with pull requests)
Our version control system now has a full history of what we deploy
Compares to "Infrastructure-as-Code", but for app deployments
Specifying the namespace
When creating resources from YAML manifests, the namespace is optional
If we specify a namespace:
resources are created in the specified namespace
this is typical for things deployed only once per cluster
example: system components, cluster add-ons ...
If we don't specify a namespace:
resources are created in the current namespace
this is typical for things that may be deployed multiple times
example: applications (production, staging, feature branches ...)
:EN:- Deploying with YAML manifests :FR:- Déployer avec des manifests YAML
Setting up Kubernetes
(automatically generated title slide)
Setting up Kubernetes
Kubernetes is made of many components that require careful configuration
Secure operation typically requires TLS certificates and a local CA
(certificate authority)
Setting up everything manually is possible, but rarely done
(except for learning purposes)
Let's do a quick overview of available options!
Local development
Are you writing code that will eventually run on Kubernetes?
Then it's a good idea to have a development cluster!
Development clusters only need one node
This simplifies their setup a lot:
pod networking doesn't even need CNI plugins, overlay networks, etc.
they can be fully contained (no pun intended) in an easy-to-ship VM image
some of the security aspects may be simplified (different threat model)
Examples: Docker Desktop, k3d, KinD, MicroK8s, Minikube
(some of these also support clusters with multiple nodes)
Managed clusters
Many cloud providers and hosting providers offer "managed Kubernetes"
The deployment and maintenance of the cluster is entirely managed by the provider
(ideally, clusters can be spun up automatically through an API, CLI, or web interface)
Given the complexity of Kubernetes, this approach is strongly recommended
(at least for your first production clusters)
After working for a while with Kubernetes, you will be better equipped to decide:
whether to operate it yourself or use a managed offering
which offering or which distribution works best for you and your needs
Managed clusters details
Pricing models differ from one provider to another
nodes are generally charged at their usual price
control plane may be free or incur a small nominal fee
Beyond pricing, there are huge differences in features between providers
The "major" providers are not always the best ones!
Managed clusters differences
Most providers let you pick which Kubernetes version you want
some providers offer up-to-date versions
others lag significantly (sometimes by 2 or 3 minor versions)
Some providers offer multiple networking or storage options
Others will only support one, tied to their infrastructure
(changing that is in theory possible, but might be complex or unsupported)
Some providers let you configure or customize the control plane
(generally through Kubernetes "feature gates")
Kubernetes distributions and installers
If you want to run Kubernetes yourselves, there are many options
(free, commercial, proprietary, open source ...)
Some of them are installers, while some are complete platforms
Some of them leverage other well-known deployment tools
(like Puppet, Terraform ...)
A good starting point to explore these options is this guide
(it defines categories like "managed", "turnkey" ...)
kubeadm
kubeadm is a tool part of Kubernetes to facilitate cluster setup
Many other installers and distributions use it (but not all of them)
It can also be used by itself
Excellent starting point to install Kubernetes on your own machines
(virtual, physical, it doesn't matter)
It even supports highly available control planes, or "multi-master"
(this is more complex, though, because it introduces the need for an API load balancer)
Manual setup
The resources below are mainly for educational purposes!
Kubernetes The Hard Way by Kelsey Hightower
step by step guide to install Kubernetes on Google Cloud
covers certificates, high availability ...
“Kubernetes The Hard Way is optimized for learning, which means taking the long route to ensure you understand each task required to bootstrap a Kubernetes cluster.”
Deep Dive into Kubernetes Internals for Builders and Operators
conference presentation showing step-by-step control plane setup
emphasis on simplicity, not on security and availability
About our training clusters
- How did we set up these Kubernetes clusters that we're using?
About our training clusters
How did we set up these Kubernetes clusters that we're using?
We used
kubeadmon freshly installed VM instances running Ubuntu LTSInstall Docker
Install Kubernetes packages
Run
kubeadm initon the first node (it deploys the control plane on that node)Set up Weave (the overlay network) with a single
kubectl applycommandRun
kubeadm joinon the other nodes (with the token produced bykubeadm init)Copy the configuration file generated by
kubeadm init
Check the prepare VMs README for more details
kubeadm "drawbacks"
Doesn't set up Docker or any other container engine
(this is by design, to give us choice)
Doesn't set up the overlay network
(this is also by design, for the same reasons)
HA control plane requires some extra steps
Note that HA control plane also requires setting up a specific API load balancer
(which is beyond the scope of kubeadm)
:EN:- Various ways to install Kubernetes :FR:- Survol des techniques d'installation de Kubernetes
Running a local development cluster
(automatically generated title slide)
Running a local development cluster
Let's review some options to run Kubernetes locally
There is no "best option", it depends what you value:
ability to run on all platforms (Linux, Mac, Windows, other?)
ability to run clusters with multiple nodes
ability to run multiple clusters side by side
ability to run recent (or even, unreleased) versions of Kubernetes
availability of plugins
etc.
Docker Desktop
Available on Mac and Windows
Gives you one cluster with one node
Very easy to use if you are already using Docker Desktop:
go to Docker Desktop preferences and enable Kubernetes
Ideal for Docker users who need good integration between both platforms
k3d
Based on K3s by Rancher Labs
Requires Docker
Runs Kubernetes nodes in Docker containers
Can deploy multiple clusters, with multiple nodes, and multiple master nodes
As of June 2020, two versions co-exist: stable (1.7) and beta (3.0)
They have different syntax and options, this can be confusing
(but don't let that stop you!)
k3d in action
Install
k3d(e.g. get the binary from https://github.com/rancher/k3d/releases)Create a simple cluster:
k3d cluster create petitclusterCreate a more complex cluster with a custom version:
k3d cluster create groscluster \--image rancher/k3s:v1.18.9-k3s1 --servers 3 --agents 5(3 nodes for the control plane + 5 worker nodes)
Clusters are automatically added to
.kube/configfile
KinD
Kubernetes-in-Docker
Requires Docker (obviously!)
Deploying a single node cluster using the latest version is simple:
kind create clusterMore advanced scenarios require writing a short config file
(to define multiple nodes, multiple master nodes, set Kubernetes versions ...)
Can deploy multiple clusters
Minikube
The "legacy" option!
(note: this is not a bad thing, it means that it's very stable, has lots of plugins, etc.)
Supports many drivers
(HyperKit, Hyper-V, KVM, VirtualBox, but also Docker and many others)
Can deploy a single cluster; recent versions can deploy multiple nodes
Great option if you want a "Kubernetes first" experience
(i.e. if you don't already have Docker and/or don't want/need it)
MicroK8s
Available on Linux, and since recently, on Mac and Windows as well
The Linux version is installed through Snap
(which is pre-installed on all recent versions of Ubuntu)
Also supports clustering (as in, multiple machines running MicroK8s)
DNS is not enabled by default; enable it with
microk8s enable dns
VM with custom install
Choose your own adventure!
Pick any Linux distribution!
Build your cluster from scratch or use a Kubernetes installer!
Discover exotic CNI plugins and container runtimes!
The only limit is yourself, and the time you are willing to sink in!
:EN:- Kubernetes options for local development :FR:- Installation de Kubernetes pour travailler en local
Deploying a managed cluster
(automatically generated title slide)
Deploying a managed cluster
"The easiest way to install Kubernetes is to get someone
else to do it for you."
(Jérôme Petazzoni)
Let's see a few options to install managed clusters!
This is not an exhaustive list
(the goal is to show the actual steps to get started)
The list is sorted alphabetically
All the options mentioned here require an account with a cloud provider
... And a credit card
AKS (initial setup)
Install the Azure CLI
Login:
az loginSelect a region
Create a "resource group":
az group create --name my-aks-group --location westeurope
AKS (create cluster)
Create the cluster:
az aks create --resource-group my-aks-group --name my-aks-clusterWait about 5-10 minutes
Add credentials to
kubeconfig:az aks get-credentials --resource-group my-aks-group --name my-aks-cluster
AKS (cleanup)
Delete the cluster:
az aks delete --resource-group my-aks-group --name my-aks-clusterDelete the resource group:
az group delete --resource-group my-aks-groupNote: delete actions can take a while too!
(5-10 minutes as well)
AKS (notes)
The cluster has useful components pre-installed, such as the metrics server
There is also a product called AKS Engine:
leverages ARM (Azure Resource Manager) templates to deploy Kubernetes
it's "the library used by AKS"
fully customizable
think of it as "half-managed" Kubernetes option
Amazon EKS (the old way)
Create service roles, VPCs, and a bunch of other oddities
Try to figure out why it doesn't work
Start over, following an official AWS blog post
Try to find the missing Cloud Formation template
Amazon EKS (the old way)
Create service roles, VPCs, and a bunch of other oddities
Try to figure out why it doesn't work
Start over, following an official AWS blog post
Try to find the missing Cloud Formation template
(╯°□°)╯︵ ┻━┻
Amazon EKS (the new way)
Install
eksctlSet the usual environment variables
(AWS_DEFAULT_REGION, AWS_ACCESS_KEY, AWS_SECRET_ACCESS_KEY)
Create the cluster:
eksctl create clusterCluster can take a long time to be ready (15-20 minutes is typical)
Add cluster add-ons
(by default, it doesn't come with metrics-server, logging, etc.)
Amazon EKS (cleanup)
Delete the cluster:
eksctl delete cluster <clustername>If you need to find the name of the cluster:
eksctl get clusters
Note: the AWS documentation has been updated and now includes eksctl instructions.
Amazon EKS (notes)
Convenient if you have to use AWS
Needs extra steps to be truly production-ready
The only officially supported pod network is the Amazon VPC CNI plugin
integrates tightly with security groups and VPC networking
not suitable for high density clusters (with many small pods on big nodes)
other plugins should still work but will require extra work
Digital Ocean (initial setup)
Install
doctlGenerate API token (in web console)
Set up the CLI authentication:
doctl auth init(It will ask you for the API token)
Check the list of regions and pick one:
doctl compute region list(If you don't specify the region later, it will use
nyc1)
Digital Ocean (create cluster)
Create the cluster:
doctl kubernetes cluster create my-do-cluster [--region xxx1]Wait 5 minutes
Update
kubeconfig:kubectl config use-context do-xxx1-my-do-clusterThe cluster comes with some components (like Cilium) but no metrics server
Digital Ocean (cleanup)
List clusters (if you forgot its name):
doctl kubernetes cluster listDelete the cluster:
doctl kubernetes cluster delete my-do-cluster
GKE (initial setup)
Install
gcloudLogin:
gcloud auth initCreate a "project":
gcloud projects create my-gke-projectgcloud config set project my-gke-projectPick a region
(example:
europe-west1,us-west1, ...)
GKE (create cluster)
Create the cluster:
gcloud container clusters create my-gke-cluster --region us-west1 --num-nodes=2(without
--num-nodesyou might exhaust your IP address quota!)The first time you try to create a cluster in a given project, you get an error
- you need to enable the Kubernetes Engine API
- the error message gives you a link
- follow the link and enable the API (and billing)
(it's just a couple of clicks and it's instantaneous)
Clutser should be ready in a couple of minutes
GKE (cleanup)
List clusters (if you forgot its name):
gcloud container clusters listDelete the cluster:
gcloud container clusters delete my-gke-cluster --region us-west1Delete the project (optional):
gcloud projects delete my-gke-project
GKE (notes)
Well-rounded product overall
(it used to be one of the best managed Kubernetes offerings available; now that many other providers entered the game, that title is debatable)
The cluster comes with many add-ons
Versions lag a bit:
latest minor version (e.g. 1.18) tends to be unsupported
previous minor version (e.g. 1.17) supported through alpha channel
previous versions (e.g. 1.14-1.16) supported
Scaleway (initial setup)
After creating your account, make sure you set a password or get an API key
(by default, it uses email "magic links" to sign in)
Install
scw(you need CLI v2, which in beta as of May 2020)
Generate the CLI configuration with
scw init(it will prompt for your API key, or email + password)
Scaleway (create cluster)
Create the cluster:
k8s cluster create name=my-kapsule-cluster version=1.18.3 cni=cilium \default-pool-config.node-type=DEV1-M default-pool-config.size=3After less than 5 minutes, cluster state will be
ready(check cluster status with e.g.
scw k8s cluster liston a wide terminal )Add connection information to your
.kube/configfile:scw k8s kubeconfig install CLUSTERID(the cluster ID is shown by
scw k8s cluster list)
Scaleway (automation)
If you want to obtain the cluster ID programmatically, this will do it:
scw k8s cluster list# orCLUSTERID=$(scw k8s cluster list -o json | \jq -r '.[] | select(.name="my-kapsule-cluster") | .id')
Scaleway (cleanup)
Get cluster ID (e.g. with
scw k8s cluster list)Delete the cluster:
scw cluster delete cluster-id=$CLUSTERIDWarning: as of May 2020, load balancers have to be deleted separately!
Scaleway (notes)
The
createcommand is a bit more complex than with other providers(you must specify the Kubernetes version, CNI plugin, and node type)
To see available versions and CNI plugins, run
scw k8s version listAs of May 2020, Kapsule supports:
multiple CNI plugins, including: cilium, calico, weave, flannel
Kubernetes versions 1.15 to 1.18
multiple container runtimes, including: Docker, containerd, CRI-O
To see available node types and their price, check their pricing page
:EN:- Installing a managed cluster :FR:- Installer un cluster infogéré
Kubernetes distributions and installers
(automatically generated title slide)
Kubernetes distributions and installers
Sometimes, we need to run Kubernetes ourselves
(as opposed to "use a managed offering")
Beware: it takes a lot of work to set up and maintain Kubernetes
It might be necessary if you have specific security or compliance requirements
(e.g. national security for states that don't have a suitable domestic cloud)
There are countless distributions available
We can't review them all
We're just going to explore a few options
kops
Deploys Kubernetes using cloud infrastructure
(supports AWS, GCE, Digital Ocean ...)
Leverages special cloud features when possible
(e.g. Auto Scaling Groups ...)
kubeadm
Provisions Kubernetes nodes on top of existing machines
kubeadm initto provision a single-node control planekubeadm jointo join a node to the clusterSupports HA control plane with some extra steps
kubespray
Based on Ansible
Works on bare metal and cloud infrastructure
(good for hybrid deployments)
The expert says: ultra flexible; slow; complex
RKE (Rancher Kubernetes Engine)
Opinionated installer with low requirements
Requires a set of machines with Docker + SSH access
Supports highly available etcd and control plane
The expert says: fast; maintenance can be tricky
Terraform + kubeadm
Sometimes it is necessary to build a custom solution
Example use case:
deploying Kubernetes on OpenStack
... with highly available control plane
... and Cloud Controller Manager integration
Solution: Terraform + kubeadm (kubeadm driven by remote-exec)
And many more ...
Docker Enterprise Edition
Lokomotive, leveraging Terraform and Flatcar Linux
Pivotal Container Service (PKS)
Tarmak, leveraging Puppet and Terraform
Tectonic by CoreOS (now being integrated into Red Hat OpenShift)
Typhoon, leveraging Terraform
VMware Tanzu Kubernetes Grid (TKG)
Bottom line
Each distribution / installer has pros and cons
Before picking one, we should sort out our priorities:
cloud, on-premises, hybrid?
integration with existing network/storage architecture or equipment?
are we storing very sensitive data, like finance, health, military?
how many clusters are we deploying (and maintaining): 2, 10, 50?
which team will be responsible for deployment and maintenance?
(do they need training?)etc.
:EN:- Kubernetes distributions and installers :FR:- L'offre Kubernetes "on premises"
The Kubernetes dashboard
(automatically generated title slide)
The Kubernetes dashboard
Kubernetes resources can also be viewed with a web dashboard
Dashboard users need to authenticate
(typically with a token)
The dashboard should be exposed over HTTPS
(to prevent interception of the aforementioned token)
Ideally, this requires obtaining a proper TLS certificate
(for instance, with Let's Encrypt)
Three ways to install the dashboard
Our
k8sdirectory has no less than three manifests!dashboard-recommended.yaml(purely internal dashboard; user must be created manually)
dashboard-with-token.yaml(dashboard exposed with NodePort; creates an admin user for us)
dashboard-insecure.yamlaka YOLO(dashboard exposed over HTTP; gives root access to anonymous users)
dashboard-insecure.yaml
This will allow anyone to deploy anything on your cluster
(without any authentication whatsoever)
Do not use this, except maybe on a local cluster
(or a cluster that you will destroy a few minutes later)
On "normal" clusters, use
dashboard-with-token.yamlinstead!
What's in the manifest?
The dashboard itself
An HTTP/HTTPS unwrapper (using
socat)The guest/admin account
- Create all the dashboard resources, with the following command:kubectl apply -f ~/container.training/k8s/dashboard-insecure.yaml
Connecting to the dashboard
- Check which port the dashboard is on:kubectl get svc dashboard
You'll want the 3xxxx port.
- Connect to http://oneofournodes:3xxxx/
The dashboard will then ask you which authentication you want to use.
Dashboard authentication
We have three authentication options at this point:
token (associated with a role that has appropriate permissions)
kubeconfig (e.g. using the
~/.kube/configfile fromnode1)"skip" (use the dashboard "service account")
Let's use "skip": we're logged in!
Dashboard authentication
We have three authentication options at this point:
token (associated with a role that has appropriate permissions)
kubeconfig (e.g. using the
~/.kube/configfile fromnode1)"skip" (use the dashboard "service account")
Let's use "skip": we're logged in!
Remember, we just added a backdoor to our Kubernetes cluster!
Closing the backdoor
- Seriously, don't leave that thing running!
- Remove what we just created:kubectl delete -f ~/container.training/k8s/dashboard-insecure.yaml
The risks
The steps that we just showed you are for educational purposes only!
If you do that on your production cluster, people can and will abuse it
For an in-depth discussion about securing the dashboard,
check this excellent post on Heptio's blog
dashboard-with-token.yaml
This is a less risky way to deploy the dashboard
It's not completely secure, either:
we're using a self-signed certificate
this is subject to eavesdropping attacks
Using
kubectl port-forwardorkubectl proxyis even better
What's in the manifest?
The dashboard itself (but exposed with a
NodePort)A ServiceAccount with
cluster-adminprivileges(named
kubernetes-dashboard:cluster-admin)
- Create all the dashboard resources, with the following command:kubectl apply -f ~/container.training/k8s/dashboard-with-token.yaml
Obtaining the token
The manifest creates a ServiceAccount
Kubernetes will automatically generate a token for that ServiceAccount
- Display the token:kubectl --namespace=kubernetes-dashboard \describe secret cluster-admin-token
The token should start with eyJ... (it's a JSON Web Token).
Note that the secret name will actually be cluster-admin-token-xxxxx.
(But kubectl prefix matches are great!)
Connecting to the dashboard
- Check which port the dashboard is on:kubectl get svc --namespace=kubernetes-dashboard
You'll want the 3xxxx port.
- Connect to http://oneofournodes:3xxxx/
The dashboard will then ask you which authentication you want to use.
Dashboard authentication
Select "token" authentication
Copy paste the token (starting with
eyJ...) obtained earlierWe're logged in!
Other dashboards
-
read-only dashboard
optimized for "troubleshooting and incident response"
see vision and goals for details
-
- "provides a common operational picture for multiple Kubernetes clusters"
Security implications of kubectl apply
(automatically generated title slide)
Security implications of kubectl apply
When we do
kubectl apply -f <URL>, we create arbitrary resourcesResources can be evil; imagine a
deploymentthat ...
Security implications of kubectl apply
When we do
kubectl apply -f <URL>, we create arbitrary resourcesResources can be evil; imagine a
deploymentthat ...- starts bitcoin miners on the whole cluster
Security implications of kubectl apply
When we do
kubectl apply -f <URL>, we create arbitrary resourcesResources can be evil; imagine a
deploymentthat ...starts bitcoin miners on the whole cluster
hides in a non-default namespace
Security implications of kubectl apply
When we do
kubectl apply -f <URL>, we create arbitrary resourcesResources can be evil; imagine a
deploymentthat ...starts bitcoin miners on the whole cluster
hides in a non-default namespace
bind-mounts our nodes' filesystem
Security implications of kubectl apply
When we do
kubectl apply -f <URL>, we create arbitrary resourcesResources can be evil; imagine a
deploymentthat ...starts bitcoin miners on the whole cluster
hides in a non-default namespace
bind-mounts our nodes' filesystem
inserts SSH keys in the root account (on the node)
encrypts our data and ransoms it
☠️☠️☠️
kubectl apply is the new curl | sh
curl | shis convenientIt's safe if you use HTTPS URLs from trusted sources
kubectl apply is the new curl | sh
curl | shis convenientIt's safe if you use HTTPS URLs from trusted sources
kubectl apply -fis convenientIt's safe if you use HTTPS URLs from trusted sources
Example: the official setup instructions for most pod networks
kubectl apply is the new curl | sh
curl | shis convenientIt's safe if you use HTTPS URLs from trusted sources
kubectl apply -fis convenientIt's safe if you use HTTPS URLs from trusted sources
Example: the official setup instructions for most pod networks
It introduces new failure modes
(for instance, if you try to apply YAML from a link that's no longer valid)
:EN:- The Kubernetes dashboard :FR:- Le dashboard Kubernetes
k9s
(automatically generated title slide)
k9s
Somewhere in between CLI and GUI (or web UI), we can find the magic land of TUI
often using libraries like curses and its successors
Some folks love them, some folks hate them, some are indifferent ...
But it's nice to have different options!
Let's see one particular TUI for Kubernetes: k9s
Installing k9s
If you are using a training cluster or the shpod image, k9s is pre-installed
Otherwise, it can be installed easily:
or by fetching a binary release
We don't need to set up or configure anything
(it will use the same configuration as
kubectland other well-behaved clients)Just run
k9sto fire it up!
What kind to we want to see?
Press
:to change the type of resource to viewThen type, for instance,
nsornamespaceornam[TAB], then[ENTER]Use the arrows to move down to e.g.
kube-system, and press[ENTER]Or, type
/kubor/systo filter the output, and press[ENTER]twice(once to exit the filter, once to enter the namespace)
We now see the pods in
kube-system!
Interacting with pods
lto view logsdto describesto get a shell (won't work ifshisn't available in the container image)eto editshift-fto define port forwardingctrl-kto kill[ESC]to get out or get back
Quick navigation between namespaces
On top of the screen, we should see shortcuts like this:
<0> all<1> kube-system<2> defaultPressing the corresponding number switches to that namespace
(or shows resources across all namespaces with
0)Locate a namespace with a copy of DockerCoins, and go there!
Interacting with Deployments
View Deployments (type
:deploy[ENTER])Select e.g.
workerScale it with
sView its aggregated logs with
l
Exit
Exit at any time with
Ctrl-Ck9s will "remember" where you were
(and go back there next time you run it)
Pros
Very convenient to navigate through resources
(hopping from a deployment, to its pod, to another namespace, etc.)
Very convenient to quickly view logs of e.g. init containers
Very convenient to get a (quasi) realtime view of resources
(if we use
watch kubectl geta lot, we will probably like k9s)
Cons
Doesn't promote automation / scripting
(if you repeat the same things over and over, there is a scripting opportunity)
Not all features are available
(e.g. executing arbitrary commands in containers)
Conclusion
Try it out, and see if it makes you more productive!
:EN:- The k9s TUI :FR:- L'interface texte k9s
Tilt
(automatically generated title slide)
Tilt
What does a development workflow look like?
make changes
test / see these changes
repeat!
What does it look like, with containers?
🤔
Basic Docker workflow
Preparation
- write Dockerfiles
Iteration
- edit code
docker builddocker run- test
docker stop
Straightforward when we have a single container.
Docker workflow with volumes
Preparation
- write Dockerfiles
docker build+docker run
Iteration
- edit code
- test
Note: only works with interpreted languages.
(Compiled languages require extra work.)
Docker workflow with Compose
Preparation
- write Dockerfiles + Compose file
docker-compose up
Iteration
- edit code
- test
docker-compose up(as needed)
Simplifies complex scenarios (multiple containers).
Facilitates updating images.
Basic Kubernetes workflow
Preparation
- write Dockerfiles
- write Kubernetes YAML
- set up container registry
Iteration
- edit code
- build images
- push images
- update Kubernetes resources
Seems simple enough, right?
Basic Kubernetes workflow
Preparation
- write Dockerfiles
- write Kubernetes YAML
- set up container registry
Iteration
- edit code
- build images
- push images
- update Kubernetes resources
Ah, right ...
We need a registry
Remember "build, ship, and run"
Registries are involved in the "ship" phase
With Docker, we were building and running on the same node
We didn't need a registry!
With Kubernetes, though ...
Special case of single node clusters
If our Kubernetes has only one node ...
... We can build directly on that node ...
... We don't need to push images ...
... We don't need to run a registry!
Examples: Docker Desktop, Minikube ...
When we have more than one node
Which registry should we use?
(Docker Hub, Quay, cloud-based, self-hosted ...)
Should we use a single registry, or one per cluster or environment?
Which tags and credentials should we use?
(in particular when using a shared registry!)
How do we provision that registry and its users?
How do we adjust our Kubernetes YAML manifests?
(e.g. to inject image names and tags)
More questions
The whole cycle (build+push+update) is expensive
If we have many services, how do we update only the ones we need?
Can we take shortcuts?
(e.g. synchronized files without going through a whole build+push+update cycle)
Tilt
Tilt is a tool to address all these questions
There are other similar tools (e.g. Skaffold)
We arbitrarily decided to focus on that one
Tilt in practice
The
dockercoinsdirectory in our repository has aTiltfileGo to that directory and try
tilt upTilt should refuse to start, but it will explain why
Edit the
Tiltfileaccordingly and try againOpen the Tilt web UI
(if running Tilt on a remote machine, you will need
tilt up --host 0.0.0.0)Watch as the Dockercoins app is built, pushed, started
What's in our Tiltfile?
Kubernetes manifests for a local registry
Kubernetes manifests for DockerCoins
Instructions indicating how to build DockerCoins' images
A tiny bit of sugar
(telling Tilt which registry to use)
How does it work?
Tilt keeps track of dependencies between files and resources
(a bit like a
makethat would run continuously)It automatically alters some resources
(for instance, it updates the images used in our Kubernetes manifests)
That's it!
(And of course, it provides a great web UI, lots of libraries, etc.)
What happens when we edit a file (1/2)
Let's change e.g.
worker/worker.pyThanks to this line,
docker_build('dockercoins/worker', 'worker')... Tilt watches the
workerdirectory and uses it to builddockercoins/workerThanks to this line,
default_registry('localhost:30555')... Tilt actually renames
dockercoins/workertolocalhost:30555/dockercoins_workerTilt will tag the image with something like
tilt-xxxxxxxxxx
What happens when we edit a file (2/2)
Thanks to this line,
k8s_yaml('../k8s/dockercoins.yaml')... Tilt is aware of our Kubernetes resources
The
workerDeployment usesdockercoins/worker, so it must be updateddockercoins/workerbecomeslocalhost:30555/dockercoins_worker:tilt-xxxThe
workerDeployment gets updated on the Kubernetes clusterAll these operations (and their log output) are visible in the Tilt UI
Configuration file format
The Tiltfile is written in Starlark
(essentially a subset of Python)
Tilt monitors the Tiltfile too
(so it reloads it immediately when we change it)
Tilt "killer features"
Dependency engine
(build or run only what's necessary)
Ability to watch resources
(execute actions immediately, without explicitly running a command)
Rich library of function and helpers
(build container images, manipulate YAML manifests...)
Convenient UI (web; TUI also available)
(provides immediate feedback and logs)
Extensibility!
:EN:- Development workflow with Tilt :FR:- Développer avec Tilt
Scaling our demo app
(automatically generated title slide)
Scaling our demo app
Our ultimate goal is to get more DockerCoins
(i.e. increase the number of loops per second shown on the web UI)
Let's look at the architecture again:

The loop is done in the worker; perhaps we could try adding more workers?
Adding another worker
- All we have to do is scale the
workerDeployment
- Open a new terminal to keep an eye on our pods:kubectl get pods -w
- Now, create more
workerreplicas:kubectl scale deployment worker --replicas=2
After a few seconds, the graph in the web UI should show up.
Adding more workers
- If 2 workers give us 2x speed, what about 3 workers?
- Scale the
workerDeployment further:kubectl scale deployment worker --replicas=3
The graph in the web UI should go up again.
(This is looking great! We're gonna be RICH!)
Adding even more workers
- Let's see if 10 workers give us 10x speed!
- Scale the
workerDeployment to a bigger number:kubectl scale deployment worker --replicas=10
Adding even more workers
- Let's see if 10 workers give us 10x speed!
- Scale the
workerDeployment to a bigger number:kubectl scale deployment worker --replicas=10
The graph will peak at 10 hashes/second.
(We can add as many workers as we want: we will never go past 10 hashes/second.)
Didn't we briefly exceed 10 hashes/second?
It may look like it, because the web UI shows instant speed
The instant speed can briefly exceed 10 hashes/second
The average speed cannot
The instant speed can be biased because of how it's computed
Why instant speed is misleading
The instant speed is computed client-side by the web UI
The web UI checks the hash counter once per second
(and does a classic (h2-h1)/(t2-t1) speed computation)The counter is updated once per second by the workers
These timings are not exact
(e.g. the web UI check interval is client-side JavaScript)Sometimes, between two web UI counter measurements,
the workers are able to update the counter twiceDuring that cycle, the instant speed will appear to be much bigger
(but it will be compensated by lower instant speed before and after)
Why are we stuck at 10 hashes per second?
If this was high-quality, production code, we would have instrumentation
(Datadog, Honeycomb, New Relic, statsd, Sumologic, ...)
It's not!
Perhaps we could benchmark our web services?
(with tools like
ab, or even simpler,httping)
Benchmarking our web services
We want to check
hasherandrngWe are going to use
httpingIt's just like
ping, but using HTTPGETrequests(it measures how long it takes to perform one
GETrequest)It's used like this:
httping [-c count] http://host:port/pathOr even simpler:
httping ip.ad.dr.essWe will use
httpingon the ClusterIP addresses of our services
Obtaining ClusterIP addresses
We can simply check the output of
kubectl get servicesOr do it programmatically, as in the example below
- Retrieve the IP addresses:HASHER=$(kubectl get svc hasher -o go-template={{.spec.clusterIP}})RNG=$(kubectl get svc rng -o go-template={{.spec.clusterIP}})
Now we can access the IP addresses of our services through $HASHER and $RNG.
Checking hasher and rng response times
- Check the response times for both services:httping -c 3 $HASHERhttping -c 3 $RNG
hasheris fine (it should take a few milliseconds to reply)rngis not (it should take about 700 milliseconds if there are 10 workers)Something is wrong with
rng, but ... what?
:EN:- Scaling up our demo app :FR:- Scale up de l'application de démo
Let's draw hasty conclusions
The bottleneck seems to be
rngWhat if we don't have enough entropy and can't generate enough random numbers?
We need to scale out the
rngservice on multiple machines!
Note: this is a fiction! We have enough entropy. But we need a pretext to scale out.
(In fact, the code of rng uses /dev/urandom, which never runs out of entropy...
...and is just as good as /dev/random.)
Daemon sets
(automatically generated title slide)
Daemon sets
We want to scale
rngin a way that is different from how we scaledworkerWe want one (and exactly one) instance of
rngper nodeWe do not want two instances of
rngon the same nodeWe will do that with a daemon set
Why not a deployment?
- Can't we just do
kubectl scale deployment rng --replicas=...?
Why not a deployment?
Can't we just do
kubectl scale deployment rng --replicas=...?Nothing guarantees that the
rngcontainers will be distributed evenlyIf we add nodes later, they will not automatically run a copy of
rngIf we remove (or reboot) a node, one
rngcontainer will restart elsewhere(and we will end up with two instances
rngon the same node)By contrast, a daemon set will start one pod per node and keep it that way
(as nodes are added or removed)
Daemon sets in practice
Daemon sets are great for cluster-wide, per-node processes:
kube-proxyweave(our overlay network)monitoring agents
hardware management tools (e.g. SCSI/FC HBA agents)
etc.
They can also be restricted to run only on some nodes
Creating a daemon set
- Unfortunately, as of Kubernetes 1.19, the CLI cannot create daemon sets
Creating a daemon set
Unfortunately, as of Kubernetes 1.19, the CLI cannot create daemon sets
More precisely: it doesn't have a subcommand to create a daemon set
Creating a daemon set
Unfortunately, as of Kubernetes 1.19, the CLI cannot create daemon sets
More precisely: it doesn't have a subcommand to create a daemon set
But any kind of resource can always be created by providing a YAML description:
kubectl apply -f foo.yaml
Creating a daemon set
Unfortunately, as of Kubernetes 1.19, the CLI cannot create daemon sets
More precisely: it doesn't have a subcommand to create a daemon set
But any kind of resource can always be created by providing a YAML description:
kubectl apply -f foo.yaml
- How do we create the YAML file for our daemon set?
Creating a daemon set
Unfortunately, as of Kubernetes 1.19, the CLI cannot create daemon sets
More precisely: it doesn't have a subcommand to create a daemon set
But any kind of resource can always be created by providing a YAML description:
kubectl apply -f foo.yaml
How do we create the YAML file for our daemon set?
- option 1: read the docs
Creating a daemon set
Unfortunately, as of Kubernetes 1.19, the CLI cannot create daemon sets
More precisely: it doesn't have a subcommand to create a daemon set
But any kind of resource can always be created by providing a YAML description:
kubectl apply -f foo.yaml
How do we create the YAML file for our daemon set?
option 1: read the docs
option 2:
viour way out of it
Creating the YAML file for our daemon set
- Let's start with the YAML file for the current
rngresource
Dump the
rngresource in YAML:kubectl get deploy/rng -o yaml >rng.ymlEdit
rng.yml
"Casting" a resource to another
What if we just changed the
kindfield?(It can't be that easy, right?)
- Change
kind: Deploymenttokind: DaemonSet
Save, quit
Try to create our new resource:
kubectl apply -f rng.yml
"Casting" a resource to another
What if we just changed the
kindfield?(It can't be that easy, right?)
- Change
kind: Deploymenttokind: DaemonSet
Save, quit
Try to create our new resource:
kubectl apply -f rng.yml
We all knew this couldn't be that easy, right!
Understanding the problem
- The core of the error is:error validating data:[ValidationError(DaemonSet.spec):unknown field "replicas" in io.k8s.api.extensions.v1beta1.DaemonSetSpec,...
Understanding the problem
- The core of the error is:error validating data:[ValidationError(DaemonSet.spec):unknown field "replicas" in io.k8s.api.extensions.v1beta1.DaemonSetSpec,...
- Obviously, it doesn't make sense to specify a number of replicas for a daemon set
Understanding the problem
- The core of the error is:error validating data:[ValidationError(DaemonSet.spec):unknown field "replicas" in io.k8s.api.extensions.v1beta1.DaemonSetSpec,...
Obviously, it doesn't make sense to specify a number of replicas for a daemon set
Workaround: fix the YAML
- remove the
replicasfield - remove the
strategyfield (which defines the rollout mechanism for a deployment) - remove the
progressDeadlineSecondsfield (also used by the rollout mechanism) - remove the
status: {}line at the end
- remove the
Or, we could also ...
Use the --force, Luke
We could also tell Kubernetes to ignore these errors and try anyway
The
--forceflag's actual name is--validate=false
- Try to load our YAML file and ignore errors:kubectl apply -f rng.yml --validate=false
Use the --force, Luke
We could also tell Kubernetes to ignore these errors and try anyway
The
--forceflag's actual name is--validate=false
- Try to load our YAML file and ignore errors:kubectl apply -f rng.yml --validate=false
🎩✨🐇
Use the --force, Luke
We could also tell Kubernetes to ignore these errors and try anyway
The
--forceflag's actual name is--validate=false
- Try to load our YAML file and ignore errors:kubectl apply -f rng.yml --validate=false
🎩✨🐇
Wait ... Now, can it be that easy?
Checking what we've done
- Did we transform our
deploymentinto adaemonset?
- Look at the resources that we have now:kubectl get all
Checking what we've done
- Did we transform our
deploymentinto adaemonset?
- Look at the resources that we have now:kubectl get all
We have two resources called rng:
the deployment that was existing before
the daemon set that we just created
We also have one too many pods.
(The pod corresponding to the deployment still exists.)
deploy/rng and ds/rng
You can have different resource types with the same name
(i.e. a deployment and a daemon set both named
rng)We still have the old
rngdeploymentNAME DESIRED CURRENT UP-TO-DATE AVAILABLE AGEdeployment.apps/rng 1 1 1 1 18mBut now we have the new
rngdaemon set as wellNAME DESIRED CURRENT READY UP-TO-DATE AVAILABLE NODE SELECTOR AGEdaemonset.apps/rng 2 2 2 2 2 <none> 9s
Too many pods
If we check with
kubectl get pods, we see:one pod for the deployment (named
rng-xxxxxxxxxx-yyyyy)one pod per node for the daemon set (named
rng-zzzzz)
NAME READY STATUS RESTARTS AGErng-54f57d4d49-7pt82 1/1 Running 0 11mrng-b85tm 1/1 Running 0 25srng-hfbrr 1/1 Running 0 25s[...]
Too many pods
If we check with
kubectl get pods, we see:one pod for the deployment (named
rng-xxxxxxxxxx-yyyyy)one pod per node for the daemon set (named
rng-zzzzz)
NAME READY STATUS RESTARTS AGErng-54f57d4d49-7pt82 1/1 Running 0 11mrng-b85tm 1/1 Running 0 25srng-hfbrr 1/1 Running 0 25s[...]
The daemon set created one pod per node, except on the master node.
The master node has taints preventing pods from running there.
(To schedule a pod on this node anyway, the pod will require appropriate tolerations.)
(Off by one? We don't run these pods on the node hosting the control plane.)
Is this working?
- Look at the web UI
Is this working?
Look at the web UI
The graph should now go above 10 hashes per second!
Is this working?
Look at the web UI
The graph should now go above 10 hashes per second!
It looks like the newly created pods are serving traffic correctly
How and why did this happen?
(We didn't do anything special to add them to the
rngservice load balancer!)
Labels and selectors
(automatically generated title slide)
Labels and selectors
The
rngservice is load balancing requests to a set of podsThat set of pods is defined by the selector of the
rngservice
- Check the selector in the
rngservice definition:kubectl describe service rng
The selector is
app=rngIt means "all the pods having the label
app=rng"(They can have additional labels as well, that's OK!)
Selector evaluation
We can use selectors with many
kubectlcommandsFor instance, with
kubectl get,kubectl logs,kubectl delete... and more
- Get the list of pods matching selector
app=rng:kubectl get pods -l app=rngkubectl get pods --selector app=rng
But ... why do these pods (in particular, the new ones) have this app=rng label?
Where do labels come from?
When we create a deployment with
kubectl create deployment rng,
this deployment gets the labelapp=rngThe replica sets created by this deployment also get the label
app=rngThe pods created by these replica sets also get the label
app=rngWhen we created the daemon set from the deployment, we re-used the same spec
Therefore, the pods created by the daemon set get the same labels
Note: when we use kubectl run stuff, the label is run=stuff instead.
Updating load balancer configuration
We would like to remove a pod from the load balancer
What would happen if we removed that pod, with
kubectl delete pod ...?
Updating load balancer configuration
We would like to remove a pod from the load balancer
What would happen if we removed that pod, with
kubectl delete pod ...?It would be re-created immediately (by the replica set or the daemon set)
Updating load balancer configuration
We would like to remove a pod from the load balancer
What would happen if we removed that pod, with
kubectl delete pod ...?It would be re-created immediately (by the replica set or the daemon set)
What would happen if we removed the
app=rnglabel from that pod?
Updating load balancer configuration
We would like to remove a pod from the load balancer
What would happen if we removed that pod, with
kubectl delete pod ...?It would be re-created immediately (by the replica set or the daemon set)
What would happen if we removed the
app=rnglabel from that pod?It would also be re-created immediately
Why?!?
Selectors for replica sets and daemon sets
The "mission" of a replica set is:
"Make sure that there is the right number of pods matching this spec!"
The "mission" of a daemon set is:
"Make sure that there is a pod matching this spec on each node!"
Selectors for replica sets and daemon sets
The "mission" of a replica set is:
"Make sure that there is the right number of pods matching this spec!"
The "mission" of a daemon set is:
"Make sure that there is a pod matching this spec on each node!"
In fact, replica sets and daemon sets do not check pod specifications
They merely have a selector, and they look for pods matching that selector
Yes, we can fool them by manually creating pods with the "right" labels
Bottom line: if we remove our
app=rnglabel ...... The pod "disappears" for its parent, which re-creates another pod to replace it
Isolation of replica sets and daemon sets
Since both the
rngdaemon set and therngreplica set useapp=rng...... Why don't they "find" each other's pods?
Isolation of replica sets and daemon sets
Since both the
rngdaemon set and therngreplica set useapp=rng...... Why don't they "find" each other's pods?
Replica sets have a more specific selector, visible with
kubectl describe(It looks like
app=rng,pod-template-hash=abcd1234)Daemon sets also have a more specific selector, but it's invisible
(It looks like
app=rng,controller-revision-hash=abcd1234)As a result, each controller only "sees" the pods it manages
Removing a pod from the load balancer
Currently, the
rngservice is defined by theapp=rngselectorThe only way to remove a pod is to remove or change the
applabel... But that will cause another pod to be created instead!
What's the solution?
Removing a pod from the load balancer
Currently, the
rngservice is defined by theapp=rngselectorThe only way to remove a pod is to remove or change the
applabel... But that will cause another pod to be created instead!
What's the solution?
We need to change the selector of the
rngservice!Let's add another label to that selector (e.g.
active=yes)
Selectors with multiple labels
If a selector specifies multiple labels, they are understood as a logical AND
(in other words: the pods must match all the labels)
We cannot have a logical OR
(e.g.
app=api AND (release=prod OR release=preprod))We can, however, apply as many extra labels as we want to our pods:
use selector
app=api AND prod-or-preprod=yesadd
prod-or-preprod=yesto both sets of pods
We will see later that in other places, we can use more advanced selectors
The plan
Add the label
active=yesto all ourrngpodsUpdate the selector for the
rngservice to also includeactive=yesToggle traffic to a pod by manually adding/removing the
activelabelProfit!
Note: if we swap steps 1 and 2, it will cause a short service disruption, because there will be a period of time during which the service selector won't match any pod. During that time, requests to the service will time out. By doing things in the order above, we guarantee that there won't be any interruption.
Adding labels to pods
We want to add the label
active=yesto all pods that haveapp=rngWe could edit each pod one by one with
kubectl edit...... Or we could use
kubectl labelto label them allkubectl labelcan use selectors itself
- Add
active=yesto all pods that haveapp=rng:kubectl label pods -l app=rng active=yes
Updating the service selector
We need to edit the service specification
Reminder: in the service definition, we will see
app: rngin two placesthe label of the service itself (we don't need to touch that one)
the selector of the service (that's the one we want to change)
- Update the service to add
active: yesto its selector:kubectl edit service rng
... And then we get the weirdest error ever. Why?
When the YAML parser is being too smart
YAML parsers try to help us:
xyzis the string"xyz"42is the integer42yesis the boolean valuetrue
If we want the string
"42"or the string"yes", we have to quote themSo we have to use
active: "yes"
For a good laugh: if we had used "ja", "oui", "si" ... as the value, it would have worked!
Updating the service selector, take 2
Update the YAML manifest of the service
Add
active: "yes"to its selector
This time it should work!
If we did everything correctly, the web UI shouldn't show any change.
Updating labels
We want to disable the pod that was created by the deployment
All we have to do, is remove the
activelabel from that podTo identify that pod, we can use its name
... Or rely on the fact that it's the only one with a
pod-template-hashlabelGood to know:
kubectl label ... foo=doesn't remove a label (it sets it to an empty string)to remove label
foo, usekubectl label ... foo-to change an existing label, we would need to add
--overwrite
Removing a pod from the load balancer
- In one window, check the logs of that pod:
- In another window, remove the label from the pod:
There might be a slight change in the web UI (since we removed a bit
of capacity from the rng service). If we remove more pods,
the effect should be more visible.
Updating the daemon set
If we scale up our cluster by adding new nodes, the daemon set will create more pods
These pods won't have the
active=yeslabelIf we want these pods to have that label, we need to edit the daemon set spec
We can do that with e.g.
kubectl edit daemonset rng
We've put resources in your resources
Reminder: a daemon set is a resource that creates more resources!
There is a difference between:
the label(s) of a resource (in the
metadatablock in the beginning)the selector of a resource (in the
specblock)the label(s) of the resource(s) created by the first resource (in the
templateblock)
We would need to update the selector and the template
(metadata labels are not mandatory)
The template must match the selector
(i.e. the resource will refuse to create resources that it will not select)
Labels and debugging
When a pod is misbehaving, we can delete it: another one will be recreated
But we can also change its labels
It will be removed from the load balancer (it won't receive traffic anymore)
Another pod will be recreated immediately
But the problematic pod is still here, and we can inspect and debug it
We can even re-add it to the rotation if necessary
(Very useful to troubleshoot intermittent and elusive bugs)
Labels and advanced rollout control
Conversely, we can add pods matching a service's selector
These pods will then receive requests and serve traffic
Examples:
one-shot pod with all debug flags enabled, to collect logs
pods created automatically, but added to rotation in a second step
(by setting their label accordingly)
This gives us building blocks for canary and blue/green deployments
Advanced label selectors
As indicated earlier, service selectors are limited to a
ANDBut in many other places in the Kubernetes API, we can use complex selectors
(e.g. Deployment, ReplicaSet, DaemonSet, NetworkPolicy ...)
These allow extra operations; specifically:
checking for presence (or absence) of a label
checking if a label is (or is not) in a given set
Relevant documentation:
Example of advanced selector
theSelector: matchLabels: app: portal component: api matchExpressions: - key: release operator: In values: [ production, preproduction ] - key: signed-off-by operator: ExistsThis selector matches pods that meet all the indicated conditions.
operator can be In, NotIn, Exists, DoesNotExist.
A nil selector matches nothing, a {} selector matches everything.
(Because that means "match all pods that meet at least zero condition".)
Services and Endpoints
Each Service has a corresponding Endpoints resource
(see
kubectl get endpointsorkubectl get ep)That Endpoints resource is used by various controllers
(e.g.
kube-proxywhen setting upiptablesrules for ClusterIP services)These Endpoints are populated (and updated) with the Service selector
We can update the Endpoints manually, but our changes will get overwritten
... Except if the Service selector is empty!
Empty Service selector
If a service selector is empty, Endpoints don't get updated automatically
(but we can still set them manually)
This lets us create Services pointing to arbitrary destinations
(potentially outside the cluster; or things that are not in pods)
Another use-case: the
kubernetesservice in thedefaultnamespace(its Endpoints are maintained automatically by the API server)
:EN:- Scaling with Daemon Sets :FR:- Utilisation de Daemon Sets
Authoring YAML
(automatically generated title slide)
Authoring YAML
We have already generated YAML implicitly, with e.g.:
kubectl runkubectl create deployment(and a few otherkubectl createvariants)kubectl expose
When and why do we need to write our own YAML?
How do we write YAML from scratch?
The limits of generated YAML
Many advanced (and even not-so-advanced) features require to write YAML:
pods with multiple containers
resource limits
healthchecks
DaemonSets, StatefulSets
and more!
How do we access these features?
Various ways to write YAML
Completely from scratch with our favorite editor
(yeah, right)
Dump an existing resource with
kubectl get -o yaml ...(it is recommended to clean up the result)
Ask
kubectlto generate the YAML(with a
kubectl create --dry-run -o yaml)Use The Docs, Luke
(the documentation almost always has YAML examples)
Generating YAML from scratch
Start with a namespace:
kind: NamespaceapiVersion: v1metadata:name: helloWe can use
kubectl explainto see resource definitions:kubectl explain -r pod.specNot the easiest option!
Dump the YAML for an existing resource
kubectl get -o yamlworks!A lot of fields in
metadataare not necessary(
managedFields,resourceVersion,uid,creationTimestamp...)Most objects will have a
statusfield that is not necessaryDefault or empty values can also be removed for clarity
This can be done manually or with the
kubectl-neatpluginkubectl get -o yaml ... | kubectl neat
Generating YAML without creating resources
- We can use the
--dry-runoption
Generate the YAML for a Deployment without creating it:
kubectl create deployment web --image nginx --dry-runOptionally clean it up with
kubectl neat, too
Note: in recent versions of Kubernetes, we should use --dry-run=client
(Or --dry-run=server; more on that later!)
Using --dry-run with kubectl apply
The
--dry-runoption can also be used withkubectl applyHowever, it can be misleading (it doesn't do a "real" dry run)
Let's see what happens in the following scenario:
generate the YAML for a Deployment
tweak the YAML to transform it into a DaemonSet
apply that YAML to see what would actually be created
The limits of kubectl apply --dry-run
Generate the YAML for a deployment:
kubectl create deployment web --image=nginx -o yaml > web.yamlChange the
kindin the YAML to make it aDaemonSet:sed -i s/Deployment/DaemonSet/ web.yamlAsk
kubectlwhat would be applied:kubectl apply -f web.yaml --dry-run --validate=false -o yaml
The resulting YAML doesn't represent a valid DaemonSet.
Server-side dry run
Since Kubernetes 1.13, we can use server-side dry run and diffs
Server-side dry run will do all the work, but not persist to etcd
(all validation and mutation hooks will be executed)
- Try the same YAML file as earlier, with server-side dry run:kubectl apply -f web.yaml --dry-run=server --validate=false -o yaml
The resulting YAML doesn't have the replicas field anymore.
Instead, it has the fields expected in a DaemonSet.
Advantages of server-side dry run
The YAML is verified much more extensively
The only step that is skipped is "write to etcd"
YAML that passes server-side dry run should apply successfully
(unless the cluster state changes by the time the YAML is actually applied)
Validating or mutating hooks that have side effects can also be an issue
kubectl diff
Kubernetes 1.13 also introduced
kubectl diffkubectl diffdoes a server-side dry run, and shows differences
- Try
kubectl diffon the YAML that we tweaked earlier:kubectl diff -f web.yaml
Note: we don't need to specify --validate=false here.
Advantage of YAML
Using YAML (instead of
kubectl create <kind>) allows to be declarativeThe YAML describes the desired state of our cluster and applications
YAML can be stored, versioned, archived (e.g. in git repositories)
To change resources, change the YAML files
(instead of using
kubectl edit/scale/label/etc.)Changes can be reviewed before being applied
(with code reviews, pull requests ...)
This workflow is sometimes called "GitOps"
(there are tools like Weave Flux or GitKube to facilitate it)
YAML in practice
Get started with
kubectl create deploymentandkubectl exposeDump the YAML with
kubectl get -o yamlTweak that YAML and
kubectl applyit backStore that YAML for reference (for further deployments)
Feel free to clean up the YAML:
remove fields you don't know
check that it still works!
That YAML will be useful later when using e.g. Kustomize or Helm
:EN:- Techniques to write YAML manifests :FR:- Comment écrire des manifests YAML
Rolling updates
(automatically generated title slide)
Rolling updates
By default (without rolling updates), when a scaled resource is updated:
new pods are created
old pods are terminated
... all at the same time
if something goes wrong, ¯\_(ツ)_/¯
Rolling updates
With rolling updates, when a Deployment is updated, it happens progressively
The Deployment controls multiple Replica Sets
Each Replica Set is a group of identical Pods
(with the same image, arguments, parameters ...)
During the rolling update, we have at least two Replica Sets:
the "new" set (corresponding to the "target" version)
at least one "old" set
We can have multiple "old" sets
(if we start another update before the first one is done)
Update strategy
Two parameters determine the pace of the rollout:
maxUnavailableandmaxSurgeThey can be specified in absolute number of pods, or percentage of the
replicascountAt any given time ...
there will always be at least
replicas-maxUnavailablepods availablethere will never be more than
replicas+maxSurgepods in totalthere will therefore be up to
maxUnavailable+maxSurgepods being updated
We have the possibility of rolling back to the previous version
(if the update fails or is unsatisfactory in any way)
Checking current rollout parameters
- Recall how we build custom reports with
kubectlandjq:
- Show the rollout plan for our deployments:kubectl get deploy -o json |jq ".items[] | {name:.metadata.name} + .spec.strategy.rollingUpdate"
Rolling updates in practice
As of Kubernetes 1.8, we can do rolling updates with:
deployments,daemonsets,statefulsetsEditing one of these resources will automatically result in a rolling update
Rolling updates can be monitored with the
kubectl rolloutsubcommand
Rolling out the new worker service
- Let's monitor what's going on by opening a few terminals, and run:kubectl get pods -wkubectl get replicasets -wkubectl get deployments -w
- Update
workereither withkubectl edit, or by running:kubectl set image deploy worker worker=dockercoins/worker:v0.2
Rolling out the new worker service
- Let's monitor what's going on by opening a few terminals, and run:kubectl get pods -wkubectl get replicasets -wkubectl get deployments -w
- Update
workereither withkubectl edit, or by running:kubectl set image deploy worker worker=dockercoins/worker:v0.2
That rollout should be pretty quick. What shows in the web UI?
Give it some time
At first, it looks like nothing is happening (the graph remains at the same level)
According to
kubectl get deploy -w, thedeploymentwas updated really quicklyBut
kubectl get pods -wtells a different storyThe old
podsare still here, and they stay inTerminatingstate for a whileEventually, they are terminated; and then the graph decreases significantly
This delay is due to the fact that our worker doesn't handle signals
Kubernetes sends a "polite" shutdown request to the worker, which ignores it
After a grace period, Kubernetes gets impatient and kills the container
(The grace period is 30 seconds, but can be changed if needed)
Rolling out something invalid
- What happens if we make a mistake?
Update
workerby specifying a non-existent image:kubectl set image deploy worker worker=dockercoins/worker:v0.3Check what's going on:
kubectl rollout status deploy worker
Rolling out something invalid
- What happens if we make a mistake?
Update
workerby specifying a non-existent image:kubectl set image deploy worker worker=dockercoins/worker:v0.3Check what's going on:
kubectl rollout status deploy worker
Our rollout is stuck. However, the app is not dead.
(After a minute, it will stabilize to be 20-25% slower.)
What's going on with our rollout?
Why is our app a bit slower?
Because
MaxUnavailable=25%... So the rollout terminated 2 replicas out of 10 available
Okay, but why do we see 5 new replicas being rolled out?
Because
MaxSurge=25%... So in addition to replacing 2 replicas, the rollout is also starting 3 more
It rounded down the number of MaxUnavailable pods conservatively,
but the total number of pods being rolled out is allowed to be 25+25=50%
The nitty-gritty details
We start with 10 pods running for the
workerdeploymentCurrent settings: MaxUnavailable=25% and MaxSurge=25%
When we start the rollout:
- two replicas are taken down (as per MaxUnavailable=25%)
- two others are created (with the new version) to replace them
- three others are created (with the new version) per MaxSurge=25%)
Now we have 8 replicas up and running, and 5 being deployed
Our rollout is stuck at this point!
Checking the dashboard during the bad rollout
If you didn't deploy the Kubernetes dashboard earlier, just skip this slide.
Connect to the dashboard that we deployed earlier
Check that we have failures in Deployments, Pods, and Replica Sets
Can we see the reason for the failure?
Recovering from a bad rollout
We could push some
v0.3image(the pod retry logic will eventually catch it and the rollout will proceed)
Or we could invoke a manual rollback
- Cancel the deployment and wait for the dust to settle:kubectl rollout undo deploy workerkubectl rollout status deploy worker
Rolling back to an older version
We reverted to
v0.2But this version still has a performance problem
How can we get back to the previous version?
Multiple "undos"
- What happens if we try
kubectl rollout undoagain?
Try it:
kubectl rollout undo deployment workerCheck the web UI, the list of pods ...
🤔 That didn't work.
Multiple "undos" don't work
If we see successive versions as a stack:
kubectl rollout undodoesn't "pop" the last element from the stackit copies the N-1th element to the top
Multiple "undos" just swap back and forth between the last two versions!
- Go back to v0.2 again:kubectl rollout undo deployment worker
In this specific scenario
Our version numbers are easy to guess
What if we had used git hashes?
What if we had changed other parameters in the Pod spec?
Listing versions
- We can list successive versions of a Deployment with
kubectl rollout history
- Look at our successive versions:kubectl rollout history deployment worker
We don't see all revisions.
We might see something like 1, 4, 5.
(Depending on how many "undos" we did before.)
Explaining deployment revisions
These revisions correspond to our Replica Sets
This information is stored in the Replica Set annotations
- Check the annotations for our replica sets:kubectl describe replicasets -l app=worker | grep -A3 ^Annotations
What about the missing revisions?
The missing revisions are stored in another annotation:
deployment.kubernetes.io/revision-historyThese are not shown in
kubectl rollout historyWe could easily reconstruct the full list with a script
(if we wanted to!)
Rolling back to an older version
kubectl rollout undocan work with a revision number
Roll back to the "known good" deployment version:
kubectl rollout undo deployment worker --to-revision=1Check the web UI or the list of pods
Changing rollout parameters
We want to:
- revert to
v0.1 - be conservative on availability (always have desired number of available workers)
- go slow on rollout speed (update only one pod at a time)
- give some time to our workers to "warm up" before starting more
- revert to
The corresponding changes can be expressed in the following YAML snippet:
spec: template: spec: containers: - name: worker image: dockercoins/worker:v0.1 strategy: rollingUpdate: maxUnavailable: 0 maxSurge: 1 minReadySeconds: 10Applying changes through a YAML patch
We could use
kubectl edit deployment workerBut we could also use
kubectl patchwith the exact YAML shown before
- Apply all our changes and wait for them to take effect:kubectl patch deployment worker -p "spec:template:spec:containers:- name: workerimage: dockercoins/worker:v0.1strategy:rollingUpdate:maxUnavailable: 0maxSurge: 1minReadySeconds: 10"kubectl rollout status deployment workerkubectl get deploy -o json worker |jq "{name:.metadata.name} + .spec.strategy.rollingUpdate"
:EN:- Rolling updates :EN:- Rolling back a bad deployment
:FR:- Mettre à jour un déploiement :FR:- Concept de rolling update et rollback :FR:- Paramétrer la vitesse de déploiement
Healthchecks
(automatically generated title slide)
Healthchecks
Kubernetes provides two kinds of healthchecks: liveness and readiness
Healthchecks are probes that apply to containers (not to pods)
Each container can have two (optional) probes:
liveness = is this container dead or alive?
readiness = is this container ready to serve traffic?
Different probes are available (HTTP, TCP, program execution)
Let's see the difference and how to use them!
Liveness probe
Indicates if the container is dead or alive
A dead container cannot come back to life
If the liveness probe fails, the container is killed
(to make really sure that it's really dead; no zombies or undeads!)
What happens next depends on the pod's
restartPolicy:Never: the container is not restartedOnFailureorAlways: the container is restarted
When to use a liveness probe
To indicate failures that can't be recovered
deadlocks (causing all requests to time out)
internal corruption (causing all requests to error)
Anything where our incident response would be "just restart/reboot it"
Do not use liveness probes for problems that can't be fixed by a restart
- Otherwise we just restart our pods for no reason, creating useless load
Readiness probe
Indicates if the container is ready to serve traffic
If a container becomes "unready" it might be ready again soon
If the readiness probe fails:
the container is not killed
if the pod is a member of a service, it is temporarily removed
it is re-added as soon as the readiness probe passes again
When to use a readiness probe
To indicate failure due to an external cause
database is down or unreachable
mandatory auth or other backend service unavailable
To indicate temporary failure or unavailability
application can only service N parallel connections
runtime is busy doing garbage collection or initial data load
For processes that take a long time to start
(more on that later)
Dependencies
If a web server depends on a database to function, and the database is down:
the web server's liveness probe should succeed
the web server's readiness probe should fail
Same thing for any hard dependency (without which the container can't work)
Do not fail liveness probes for problems that are external to the container
Timing and thresholds
Probes are executed at intervals of
periodSeconds(default: 10)The timeout for a probe is set with
timeoutSeconds(default: 1)
If a probe takes longer than that, it is considered as a FAIL
A probe is considered successful after
successThresholdsuccesses (default: 1)A probe is considered failing after
failureThresholdfailures (default: 3)A probe can have an
initialDelaySecondsparameter (default: 0)Kubernetes will wait that amount of time before running the probe for the first time
(this is important to avoid killing services that take a long time to start)
Startup probe
Kubernetes 1.16 introduces a third type of probe:
startupProbe(it is in
alphain Kubernetes 1.16)It can be used to indicate "container not ready yet"
process is still starting
loading external data, priming caches
Before Kubernetes 1.16, we had to use the
initialDelaySecondsparameter(available for both liveness and readiness probes)
initialDelaySecondsis a rigid delay (always wait X before running probes)startupProbeworks better when a container start time can vary a lot
Different types of probes
HTTP request
specify URL of the request (and optional headers)
any status code between 200 and 399 indicates success
TCP connection
- the probe succeeds if the TCP port is open
arbitrary exec
a command is executed in the container
exit status of zero indicates success
Benefits of using probes
Rolling updates proceed when containers are actually ready
(as opposed to merely started)
Containers in a broken state get killed and restarted
(instead of serving errors or timeouts)
Unavailable backends get removed from load balancer rotation
(thus improving response times across the board)
If a probe is not defined, it's as if there was an "always successful" probe
Example: HTTP probe
Here is a pod template for the rng web service of the DockerCoins app:
apiVersion: v1kind: Podmetadata: name: rng-with-livenessspec: containers: - name: rng image: dockercoins/rng:v0.1 livenessProbe: httpGet: path: / port: 80 initialDelaySeconds: 10 periodSeconds: 1If the backend serves an error, or takes longer than 1s, 3 times in a row, it gets killed.
Example: exec probe
Here is a pod template for a Redis server:
apiVersion: v1kind: Podmetadata: name: redis-with-livenessspec: containers: - name: redis image: redis livenessProbe: exec: command: ["redis-cli", "ping"]If the Redis process becomes unresponsive, it will be killed.
Questions to ask before adding healthchecks
Do we want liveness, readiness, both?
(sometimes, we can use the same check, but with different failure thresholds)
Do we have existing HTTP endpoints that we can use?
Do we need to add new endpoints, or perhaps use something else?
Are our healthchecks likely to use resources and/or slow down the app?
Do they depend on additional services?
(this can be particularly tricky, see next slide)
Healthchecks and dependencies
Liveness checks should not be influenced by the state of external services
All checks should reply quickly (by default, less than 1 second)
Otherwise, they are considered to fail
This might require to check the health of dependencies asynchronously
(e.g. if a database or API might be healthy but still take more than 1 second to reply, we should check the status asynchronously and report a cached status)
Healthchecks for workers
(In that context, worker = process that doesn't accept connections)
Readiness isn't useful
(because workers aren't backends for a service)
Liveness may help us restart a broken worker, but how can we check it?
Embedding an HTTP server is a (potentially expensive) option
Using a "lease" file can be relatively easy:
touch a file during each iteration of the main loop
check the timestamp of that file from an exec probe
Writing logs (and checking them from the probe) also works
:EN:- Using healthchecks to improve availability :FR:- Utiliser des healthchecks pour améliorer la disponibilité
Adding healthchecks to an app
Let's add healthchecks to DockerCoins!
We will examine the questions of the previous slide
Then we will review each component individually to add healthchecks
Liveness, readiness, or both?
To answer that question, we need to see the app run for a while
Do we get temporary, recoverable glitches?
→ then use readiness
Or do we get hard lock-ups requiring a restart?
→ then use liveness
In the case of DockerCoins, we don't know yet!
Let's pick liveness
Do we have HTTP endpoints that we can use?
Each of the 3 web services (hasher, rng, webui) has a trivial route on
/These routes:
don't seem to perform anything complex or expensive
don't seem to call other services
Perfect!
(See next slides for individual details)
-
get '/' do"HASHER running on #{Socket.gethostname}\n"end
-
@app.route("/")def index():return "RNG running on {}\n".format(hostname)
-
app.get('/', function (req, res) {res.redirect('/index.html');});
Running DockerCoins
We will run DockerCoins in a new, separate namespace
We will use a set of YAML manifests and pre-built images
We will add our new liveness probe to the YAML of the
rngDaemonSetThen, we will deploy the application
Creating a new namespace
- This will make sure that we don't collide / conflict with previous exercises
Create the yellow namespace:
kubectl create namespace yellowSwitch to that namespace:
kns yellow
Retrieving DockerCoins manifests
All the manifests that we need are on a convenient repository:
Clone that repository:
cd ~git clone https://github.com/jpetazzo/kubercoinsChange directory to the repository:
cd kubercoins
A simple HTTP liveness probe
This is what our liveness probe should look like:
containers:- name: ...image: ...livenessProbe: httpGet: path: / port: 80 initialDelaySeconds: 30 periodSeconds: 5This will give 30 seconds to the service to start. (Way more than necessary!)
It will run the probe every 5 seconds.
It will use the default timeout (1 second).
It will use the default failure threshold (3 failed attempts = dead).
It will use the default success threshold (1 successful attempt = alive).
Adding the liveness probe
- Let's add the liveness probe, then deploy DockerCoins
Edit
rng-deployment.yamland add the liveness probevim rng-deployment.yamlLoad the YAML for all the resources of DockerCoins:
kubectl apply -f .
Testing the liveness probe
The rng service needs 100ms to process a request
(because it is single-threaded and sleeps 0.1s in each request)
The probe timeout is set to 1 second
If we send more than 10 requests per second per backend, it will break
Let's generate traffic and see what happens!
- Get the ClusterIP address of the rng service:kubectl get svc rng
Monitoring the rng service
- Each command below will show us what's happening on a different level
In one window, monitor cluster events:
kubectl get events -wIn another window, monitor the response time of rng:
httping <ClusterIP>In another window, monitor pods status:
kubectl get pods -w
Generating traffic
- Let's use
abto send concurrent requests to rng
In yet another window, generate traffic:
ab -c 10 -n 1000 http://<ClusterIP>/1Experiment with higher values of
-cand see what happens
The
-cparameter indicates the number of concurrent requestsThe final
/1is important to generate actual traffic(otherwise we would use the ping endpoint, which doesn't sleep 0.1s per request)
Discussion
Above a given threshold, the liveness probe starts failing
(about 10 concurrent requests per backend should be plenty enough)
When the liveness probe fails 3 times in a row, the container is restarted
During the restart, there is less capacity available
... Meaning that the other backends are likely to timeout as well
... Eventually causing all backends to be restarted
... And each fresh backend gets restarted, too
This goes on until the load goes down, or we add capacity
This wouldn't be a good healthcheck in a real application!
Better healthchecks
We need to make sure that the healthcheck doesn't trip when performance degrades due to external pressure
Using a readiness check would have fewer effects
(but it would still be an imperfect solution)
A possible combination:
readiness check with a short timeout / low failure threshold
liveness check with a longer timeout / higher failure threshold
Healthchecks for redis
A liveness probe is enough
(it's not useful to remove a backend from rotation when it's the only one)
We could use an exec probe running
redis-cli ping
Exec probes and zombies
When using exec probes, we should make sure that we have a zombie reaper
🤔🧐🧟 Wait, what?
When a process terminates, its parent must call
wait()/waitpid()(this is how the parent process retrieves the child's exit status)
In the meantime, the process is in zombie state
(the process state will show as
Zinps,top...)When a process is killed, its children are orphaned and attached to PID 1
PID 1 has the responsibility of reaping these processes when they terminate
OK, but how does that affect us?
PID 1 in containers
On ordinary systems, PID 1 (
/sbin/init) has logic to reap processesIn containers, PID 1 is typically our application process
(e.g. Apache, the JVM, NGINX, Redis ...)
These do not take care of reaping orphans
If we use exec probes, we need to add a process reaper
We can add tini to our images
Or share the PID namespace between containers of a pod
(and have gcr.io/pause take care of the reaping)
Discussion of this in Video - 10 Ways to Shoot Yourself in the Foot with Kubernetes, #9 Will Surprise You
:EN:- Adding healthchecks to an app :FR:- Ajouter des healthchecks à une application
Recording deployment actions
(automatically generated title slide)
Recording deployment actions
Some commands that modify a Deployment accept an optional
--recordflag(Example:
kubectl set image deployment worker worker=alpine --record)That flag will store the command line in the Deployment
(Technically, using the annotation
kubernetes.io/change-cause)It gets copied to the corresponding ReplicaSet
(Allowing to keep track of which command created or promoted this ReplicaSet)
We can view this information with
kubectl rollout history
Using --record
- Let's make a couple of changes to a Deployment and record them
Roll back
workerto image version 0.1:kubectl set image deployment worker worker=dockercoins/worker:v0.1 --recordPromote it to version 0.2 again:
kubectl set image deployment worker worker=dockercoins/worker:v0.2 --recordView the change history:
kubectl rollout history deployment worker
Pitfall #1: forgetting --record
- What happens if we don't specify
--record?
Promote
workerto image version 0.3:kubectl set image deployment worker worker=dockercoins/worker:v0.3View the change history:
kubectl rollout history deployment worker
Pitfall #1: forgetting --record
- What happens if we don't specify
--record?
Promote
workerto image version 0.3:kubectl set image deployment worker worker=dockercoins/worker:v0.3View the change history:
kubectl rollout history deployment worker
It recorded version 0.2 instead of 0.3! Why?
How --record really works
kubectladds the annotationkubernetes.io/change-causeto the DeploymentThe Deployment controller copies that annotation to the ReplicaSet
kubectl rollout historyshows the ReplicaSets' annotationsIf we don't specify
--record, the annotation is not updatedThe previous value of that annotation is copied to the new ReplicaSet
In that case, the ReplicaSet annotation does not reflect reality!
Pitfall #2: recording scale commands
- What happens if we use
kubectl scale --record?
Check the current history:
kubectl rollout history deployment workerScale the deployment:
kubectl scale deployment worker --replicas=3 --recordCheck the change history again:
kubectl rollout history deployment worker
The last entry in the history was overwritten by the scale command! Why?
Actions that don't create a new ReplicaSet
The
scalecommand updates the Deployment definitionBut it doesn't create a new ReplicaSet
Using the
--recordflag sets the annotation like beforeThe annotation gets copied to the existing ReplicaSet
This overwrites the previous annotation that was there
In that case, we lose the previous change cause!
Updating the annotation directly
- Let's see what happens if we set the annotation manually
Annotate the Deployment:
kubectl annotate deployment worker kubernetes.io/change-cause="Just for fun"Check that our annotation shows up in the change history:
kubectl rollout history deployment worker
Updating the annotation directly
- Let's see what happens if we set the annotation manually
Annotate the Deployment:
kubectl annotate deployment worker kubernetes.io/change-cause="Just for fun"Check that our annotation shows up in the change history:
kubectl rollout history deployment worker
Our annotation shows up (and overwrote whatever was there before).
Using change cause
It sounds like a good idea to use
--record, but:"Incorrect documentation is often worse than no documentation."
(Bertrand Meyer)If we use
--recordonce, we need to either:use it every single time after that
or clear the Deployment annotation after using
--record
(subsequent changes will show up with a<none>change cause)
A safer way is to set it through our tooling
Namespaces
(automatically generated title slide)
Namespaces
We would like to deploy another copy of DockerCoins on our cluster
We could rename all our deployments and services:
hasher → hasher2, redis → redis2, rng → rng2, etc.
That would require updating the code
There has to be a better way!
Namespaces
We would like to deploy another copy of DockerCoins on our cluster
We could rename all our deployments and services:
hasher → hasher2, redis → redis2, rng → rng2, etc.
That would require updating the code
There has to be a better way!
As hinted by the title of this section, we will use namespaces
Identifying a resource
We cannot have two resources with the same name
(or can we...?)
Identifying a resource
We cannot have two resources with the same name
(or can we...?)
We cannot have two resources of the same kind with the same name
(but it's OK to have an
rngservice, anrngdeployment, and anrngdaemon set)
Identifying a resource
We cannot have two resources with the same name
(or can we...?)
We cannot have two resources of the same kind with the same name
(but it's OK to have an
rngservice, anrngdeployment, and anrngdaemon set)We cannot have two resources of the same kind with the same name in the same namespace
(but it's OK to have e.g. two
rngservices in different namespaces)
Identifying a resource
We cannot have two resources with the same name
(or can we...?)
We cannot have two resources of the same kind with the same name
(but it's OK to have an
rngservice, anrngdeployment, and anrngdaemon set)We cannot have two resources of the same kind with the same name in the same namespace
(but it's OK to have e.g. two
rngservices in different namespaces)Except for resources that exist at the cluster scope
(these do not belong to a namespace)
Uniquely identifying a resource
For namespaced resources:
the tuple (kind, name, namespace) needs to be unique
For resources at the cluster scope:
the tuple (kind, name) needs to be unique
- List resource types again, and check the NAMESPACED column:kubectl api-resources
Pre-existing namespaces
If we deploy a cluster with
kubeadm, we have three or four namespaces:default(for our applications)kube-system(for the control plane)kube-public(contains one ConfigMap for cluster discovery)kube-node-lease(in Kubernetes 1.14 and later; contains Lease objects)
If we deploy differently, we may have different namespaces
Creating namespaces
- Let's see two identical methods to create a namespace
We can use
kubectl create namespace:kubectl create namespace blueOr we can construct a very minimal YAML snippet:
kubectl apply -f- <<EOFapiVersion: v1kind: Namespacemetadata:name: blueEOF
Using namespaces
We can pass a
-nor--namespaceflag to mostkubectlcommands:kubectl -n blue get svcWe can also change our current context
A context is a (user, cluster, namespace) tuple
We can manipulate contexts with the
kubectl configcommand
Viewing existing contexts
- On our training environments, at this point, there should be only one context
- View existing contexts to see the cluster name and the current user:kubectl config get-contexts
The current context (the only one!) is tagged with a
*What are NAME, CLUSTER, AUTHINFO, and NAMESPACE?
What's in a context
NAME is an arbitrary string to identify the context
CLUSTER is a reference to a cluster
(i.e. API endpoint URL, and optional certificate)
AUTHINFO is a reference to the authentication information to use
(i.e. a TLS client certificate, token, or otherwise)
NAMESPACE is the namespace
(empty string =
default)
Switching contexts
We want to use a different namespace
Solution 1: update the current context
This is appropriate if we need to change just one thing (e.g. namespace or authentication).
Solution 2: create a new context and switch to it
This is appropriate if we need to change multiple things and switch back and forth.
Let's go with solution 1!
Updating a context
This is done through
kubectl config set-contextWe can update a context by passing its name, or the current context with
--current
Update the current context to use the
bluenamespace:kubectl config set-context --current --namespace=blueCheck the result:
kubectl config get-contexts
Using our new namespace
- Let's check that we are in our new namespace, then deploy a new copy of Dockercoins
- Verify that the new context is empty:kubectl get all
Deploying DockerCoins with YAML files
- The GitHub repository
jpetazzo/kubercoinscontains everything we need!
Clone the kubercoins repository:
cd ~git clone https://github.com/jpetazzo/kubercoinsCreate all the DockerCoins resources:
kubectl create -f kubercoins
If the argument behind -f is a directory, all the files in that directory are processed.
The subdirectories are not processed, unless we also add the -R flag.
Viewing the deployed app
- Let's see if this worked correctly!
Retrieve the port number allocated to the
webuiservice:kubectl get svc webuiPoint our browser to http://X.X.X.X:3xxxx
If the graph shows up but stays at zero, give it a minute or two!
Namespaces and isolation
Namespaces do not provide isolation
A pod in the
greennamespace can communicate with a pod in thebluenamespaceA pod in the
defaultnamespace can communicate with a pod in thekube-systemnamespaceCoreDNS uses a different subdomain for each namespace
Example: from any pod in the cluster, you can connect to the Kubernetes API with:
https://kubernetes.default.svc.cluster.local:443/
Isolating pods
Actual isolation is implemented with network policies
Network policies are resources (like deployments, services, namespaces...)
Network policies specify which flows are allowed:
between pods
from pods to the outside world
and vice-versa
Switch back to the default namespace
- Let's make sure that we don't run future exercises in the
bluenamespace
- Switch back to the original context:kubectl config set-context --current --namespace=
Note: we could have used --namespace=default for the same result.
Switching namespaces more easily
We can also use a little helper tool called
kubens:# Switch to namespace fookubens foo# Switch back to the previous namespacekubens -On our clusters,
kubensis calledknsinstead(so that it's even fewer keystrokes to switch namespaces)
kubens and kubectx
With
kubens, we can switch quickly between namespacesWith
kubectx, we can switch quickly between contextsBoth tools are simple shell scripts available from https://github.com/ahmetb/kubectx
On our clusters, they are installed as
knsandkctx(for brevity and to avoid completion clashes between
kubectxandkubectl)
kube-ps1
It's easy to lose track of our current cluster / context / namespace
kube-ps1makes it easy to track these, by showing them in our shell promptIt is installed on our training clusters, and when using shpod
It gives us a prompt looking like this one:
[123.45.67.89] (kubernetes-admin@kubernetes:default) docker@node1 ~(The highlighted part is
context:namespace, managed bykube-ps1)Highly recommended if you work across multiple contexts or namespaces!
Installing kube-ps1
It's a simple shell script available from https://github.com/jonmosco/kube-ps1
It needs to be installed in our profile/rc files
(instructions differ depending on platform, shell, etc.)
Once installed, it defines aliases called
kube_ps1,kubeon,kubeoff(to selectively enable/disable it when needed)
Pro-tip: install it on your machine during the next break!
:EN:- Organizing resources with Namespaces :FR:- Organiser les ressources avec des namespaces
Controlling a Kubernetes cluster remotely
(automatically generated title slide)
Controlling a Kubernetes cluster remotely
kubectlcan be used either on cluster instances or outside the clusterHere, we are going to use
kubectlfrom our local machine
Requirements
The exercises in this chapter should be done on your local machine.
kubectlis officially available on Linux, macOS, Windows(and unofficially anywhere we can build and run Go binaries)
You may skip these exercises if you are following along from:
a tablet or phone
a web-based terminal
an environment where you can't install and run new binaries
Installing kubectl
- If you already have
kubectlon your local machine, you can skip this
Note: if you are following along with a different platform (e.g. Linux on an architecture different from amd64, or with a phone or tablet), installing kubectl might be more complicated (or even impossible) so feel free to skip this section.
Testing kubectl
Check that
kubectlworks correctly(before even trying to connect to a remote cluster!)
- Ask
kubectlto show its version number:kubectl version --client
The output should look like this:
Client Version: version.Info{Major:"1", Minor:"15", GitVersion:"v1.15.0",GitCommit:"e8462b5b5dc2584fdcd18e6bcfe9f1e4d970a529", GitTreeState:"clean",BuildDate:"2019-06-19T16:40:16Z", GoVersion:"go1.12.5", Compiler:"gc",Platform:"darwin/amd64"}Preserving the existing ~/.kube/config
If you already have a
~/.kube/configfile, rename it(we are going to overwrite it in the following slides!)
If you never used
kubectlon your machine before: nothing to do!
Make a copy of
~/.kube/config; if you are using macOS or Linux, you can do:cp ~/.kube/config ~/.kube/config.before.trainingIf you are using Windows, you will need to adapt this command
Copying the configuration file from node1
The
~/.kube/configfile that is onnode1contains all the credentials we needLet's copy it over!
Copy the file from
node1; if you are using macOS or Linux, you can do:scp USER@X.X.X.X:.kube/config ~/.kube/config# Make sure to replace X.X.X.X with the IP address of node1,# and USER with the user name used to log into node1!If you are using Windows, adapt these instructions to your SSH client
Updating the server address
There is a good chance that we need to update the server address
To know if it is necessary, run
kubectl config viewLook for the
server:address:if it matches the public IP address of
node1, you're good!if it is anything else (especially a private IP address), update it!
To update the server address, run:
kubectl config set-cluster kubernetes --server=https://X.X.X.X:6443# Make sure to replace X.X.X.X with the IP address of node1!
What if we get a certificate error?
Generally, the Kubernetes API uses a certificate that is valid for:
kuberneteskubernetes.defaultkubernetes.default.svckubernetes.default.svc.cluster.local- the ClusterIP address of the
kubernetesservice - the hostname of the node hosting the control plane (e.g.
node1) - the IP address of the node hosting the control plane
On most clouds, the IP address of the node is an internal IP address
... And we are going to connect over the external IP address
... And that external IP address was not used when creating the certificate!
Working around the certificate error
We need to tell
kubectlto skip TLS verification(only do this with testing clusters, never in production!)
The following command will do the trick:
kubectl config set-cluster kubernetes --insecure-skip-tls-verify
Checking that we can connect to the cluster
- We can now run a couple of trivial commands to check that all is well
Check the versions of the local client and remote server:
kubectl versionView the nodes of the cluster:
kubectl get nodes
We can now utilize the cluster exactly as if we're logged into a node, except that it's remote.
:EN:- Working with remote Kubernetes clusters :FR:- Travailler avec des clusters distants
Accessing internal services
(automatically generated title slide)
Accessing internal services
When we are logged in on a cluster node, we can access internal services
(by virtue of the Kubernetes network model: all nodes can reach all pods and services)
When we are accessing a remote cluster, things are different
(generally, our local machine won't have access to the cluster's internal subnet)
How can we temporarily access a service without exposing it to everyone?
kubectl proxy: gives us access to the API, which includes a proxy for HTTP resourceskubectl port-forward: allows forwarding of TCP ports to arbitrary pods, services, ...
Suspension of disbelief
The exercises in this section assume that we have set up kubectl on our
local machine in order to access a remote cluster.
We will therefore show how to access services and pods of the remote cluster, from our local machine.
You can also run these exercises directly on the cluster (if you haven't
installed and set up kubectl locally).
Running commands locally will be less useful
(since you could access services and pods directly),
but keep in mind that these commands will work anywhere as long as you have
installed and set up kubectl to communicate with your cluster.
kubectl proxy in theory
Running
kubectl proxygives us access to the entire Kubernetes APIThe API includes routes to proxy HTTP traffic
These routes look like the following:
/api/v1/namespaces/<namespace>/services/<service>/proxyWe just add the URI to the end of the request, for instance:
/api/v1/namespaces/<namespace>/services/<service>/proxy/index.htmlWe can access
servicesandpodsthis way
kubectl proxy in practice
- Let's access the
webuiservice throughkubectl proxy
Run an API proxy in the background:
kubectl proxy &Access the
webuiservice:curl localhost:8001/api/v1/namespaces/default/services/webui/proxy/index.htmlTerminate the proxy:
kill %1
kubectl port-forward in theory
What if we want to access a TCP service?
We can use
kubectl port-forwardinsteadIt will create a TCP relay to forward connections to a specific port
(of a pod, service, deployment...)
The syntax is:
kubectl port-forward service/name_of_service local_port:remote_portIf only one port number is specified, it is used for both local and remote ports
kubectl port-forward in practice
- Let's access our remote Redis server
Forward connections from local port 10000 to remote port 6379:
kubectl port-forward svc/redis 10000:6379 &Connect to the Redis server:
telnet localhost 10000Issue a few commands, e.g.
INFO serverthenQUIT
- Terminate the port forwarder:kill %1
:EN:- Securely accessing internal services :FR:- Accès sécurisé aux services internes
:T: Accessing internal services from our local machine
:Q: What's the advantage of "kubectl port-forward" compared to a NodePort? :A: It can forward arbitrary protocols :A: It doesn't require Kubernetes API credentials :A: It offers deterministic load balancing (instead of random) :A: ✔️It doesn't expose the service to the public
:Q: What's the security concept behind "kubectl port-forward"? :A: ✔️We authenticate with the Kubernetes API, and it forwards connections on our behalf :A: It detects our source IP address, and only allows connections coming from it :A: It uses end-to-end mTLS (mutual TLS) to authenticate our connections :A: There is no security (as long as it's running, anyone can connect from anywhere)
Accessing the API with kubectl proxy
(automatically generated title slide)
Accessing the API with kubectl proxy
The API requires us to authenticate¹
There are many authentication methods available, including:
TLS client certificates
(that's what we've used so far)HTTP basic password authentication
(from a static file; not recommended)various token mechanisms
(detailed in the documentation)
¹OK, we lied. If you don't authenticate, you are considered to
be user system:anonymous, which doesn't have any access rights by default.
Accessing the API directly
- Let's see what happens if we try to access the API directly with
curl
Retrieve the ClusterIP allocated to the
kubernetesservice:kubectl get svc kubernetesReplace the IP below and try to connect with
curl:curl -k https://10.96.0.1/
The API will tell us that user system:anonymous cannot access this path.
Authenticating to the API
If we wanted to talk to the API, we would need to:
extract our TLS key and certificate information from
~/.kube/config(the information is in PEM format, encoded in base64)
use that information to present our certificate when connecting
(for instance, with
openssl s_client -key ... -cert ... -connect ...)figure out exactly which credentials to use
(once we start juggling multiple clusters)
change that whole process if we're using another authentication method
🤔 There has to be a better way!
Using kubectl proxy for authentication
kubectl proxyruns a proxy in the foregroundThis proxy lets us access the Kubernetes API without authentication
(
kubectl proxyadds our credentials on the fly to the requests)This proxy lets us access the Kubernetes API over plain HTTP
This is a great tool to learn and experiment with the Kubernetes API
... And for serious uses as well (suitable for one-shot scripts)
For unattended use, it's better to create a service account
Trying kubectl proxy
- Let's start
kubectl proxyand then do a simple request withcurl!
Start
kubectl proxyin the background:kubectl proxy &Access the API's default route:
curl localhost:8001
- Terminate the proxy:kill %1
The output is a list of available API routes.
OpenAPI (fka Swagger)
The Kubernetes API serves an OpenAPI Specification
(OpenAPI was formerly known as Swagger)
OpenAPI has many advantages
(generate client library code, generate test code ...)
For us, this means we can explore the API with Swagger UI
(for instance with the Swagger UI add-on for Firefox)
kubectl proxy is intended for local use
By default, the proxy listens on port 8001
(But this can be changed, or we can tell
kubectl proxyto pick a port)By default, the proxy binds to
127.0.0.1(Making it unreachable from other machines, for security reasons)
By default, the proxy only accepts connections from:
^localhost$,^127\.0\.0\.1$,^\[::1\]$This is great when running
kubectl proxylocallyNot-so-great when you want to connect to the proxy from a remote machine
Running kubectl proxy on a remote machine
If we wanted to connect to the proxy from another machine, we would need to:
bind to
INADDR_ANYinstead of127.0.0.1accept connections from any address
This is achieved with:
kubectl proxy --port=8888 --address=0.0.0.0 --accept-hosts=.*
Do not do this on a real cluster: it opens full unauthenticated access!
Security considerations
Running
kubectl proxyopenly is a huge security riskIt is slightly better to run the proxy where you need it
(and copy credentials, e.g.
~/.kube/config, to that place)It is even better to use a limited account with reduced permissions
Good to know ...
kubectl proxyalso gives access to all internal servicesSpecifically, services are exposed as such:
/api/v1/namespaces/<namespace>/services/<service>/proxyWe can use
kubectl proxyto access an internal service in a pinch(or, for non HTTP services,
kubectl port-forward)This is not very useful when running
kubectldirectly on the cluster(since we could connect to the services directly anyway)
But it is very powerful as soon as you run
kubectlfrom a remote machine
Exposing HTTP services with Ingress resources
(automatically generated title slide)
Exposing HTTP services with Ingress resources
Services give us a way to access a pod or a set of pods
Services can be exposed to the outside world:
with type
NodePort(on a port >30000)with type
LoadBalancer(allocating an external load balancer)
What about HTTP services?
how can we expose
webui,rng,hasher?the Kubernetes dashboard?
a new version of
webui?
Exposing HTTP services
If we use
NodePortservices, clients have to specify port numbers(i.e. http://xxxxx:31234 instead of just http://xxxxx)
LoadBalancerservices are nice, but:they are not available in all environments
they often carry an additional cost (e.g. they provision an ELB)
they require one extra step for DNS integration
(waiting for theLoadBalancerto be provisioned; then adding it to DNS)
We could build our own reverse proxy
Building a custom reverse proxy
There are many options available:
Apache, HAProxy, Hipache, NGINX, Traefik, ...
(look at jpetazzo/aiguillage for a minimal reverse proxy configuration using NGINX)
Most of these options require us to update/edit configuration files after each change
Some of them can pick up virtual hosts and backends from a configuration store
Wouldn't it be nice if this configuration could be managed with the Kubernetes API?
Enter¹ Ingress resources!
¹ Pun maybe intended.
Ingress resources
Kubernetes API resource (
kubectl get ingress/ingresses/ing)Designed to expose HTTP services
Basic features:
- load balancing
- SSL termination
- name-based virtual hosting
Can also route to different services depending on:
- URI path (e.g.
/api→api-service,/static→assets-service) - Client headers, including cookies (for A/B testing, canary deployment...)
- and more!
- URI path (e.g.
Principle of operation
Step 1: deploy an ingress controller
ingress controller = load balancer + control loop
the control loop watches over ingress resources, and configures the LB accordingly
Step 2: set up DNS
- associate DNS entries with the load balancer address
Step 3: create ingress resources
- the ingress controller picks up these resources and configures the LB
Step 4: profit!
Ingress in action
We will deploy the Traefik ingress controller
this is an arbitrary choice
maybe motivated by the fact that Traefik releases are named after cheeses
For DNS, we will use nip.io
*.1.2.3.4.nip.ioresolves to1.2.3.4
We will create ingress resources for various HTTP services
Deploying pods listening on port 80
We want our ingress load balancer to be available on port 80
The best way to do that would be with a
LoadBalancerservice... but it requires support from the underlying infrastructure
Instead, we are going to use the
hostNetworkmode on the Traefik podsLet's see what this
hostNetworkmode is about ...
Without hostNetwork
Normally, each pod gets its own network namespace
(sometimes called sandbox or network sandbox)
An IP address is assigned to the pod
This IP address is routed/connected to the cluster network
All containers of that pod are sharing that network namespace
(and therefore using the same IP address)
With hostNetwork: true
No network namespace gets created
The pod is using the network namespace of the host
It "sees" (and can use) the interfaces (and IP addresses) of the host
The pod can receive outside traffic directly, on any port
Downside: with most network plugins, network policies won't work for that pod
most network policies work at the IP address level
filtering that pod = filtering traffic from the node
Other techniques to expose port 80
We could use pods specifying
hostPort: 80... but with most CNI plugins, this doesn't work or requires additional setup
We could use a
NodePortservice... but that requires changing the
--service-node-port-rangeflag in the API serverWe could create a service with an external IP
... this would work, but would require a few extra steps
(figuring out the IP address and adding it to the service)
Running Traefik
The Traefik documentation tells us to pick between Deployment and Daemon Set
We are going to use a Daemon Set so that each node can accept connections
We will do two minor changes to the YAML provided by Traefik:
enable
hostNetworkadd a toleration so that Traefik also runs on
node1
Taints and tolerations
A taint is an attribute added to a node
It prevents pods from running on the node
... Unless they have a matching toleration
When deploying with
kubeadm:a taint is placed on the node dedicated to the control plane
the pods running the control plane have a matching toleration
Checking taints on our nodes
- Check our nodes specs:kubectl get node node1 -o json | jq .speckubectl get node node2 -o json | jq .spec
We should see a result only for node1 (the one with the control plane):
"taints": [ { "effect": "NoSchedule", "key": "node-role.kubernetes.io/master" } ]Understanding a taint
The
keycan be interpreted as:a reservation for a special set of pods
(here, this means "this node is reserved for the control plane")an error condition on the node
(for instance: "disk full," do not start new pods here!)
The
effectcan be:NoSchedule(don't run new pods here)PreferNoSchedule(try not to run new pods here)NoExecute(don't run new pods and evict running pods)
Checking tolerations on the control plane
- Check tolerations for CoreDNS:kubectl -n kube-system get deployments coredns -o json |jq .spec.template.spec.tolerations
The result should include:
{ "effect": "NoSchedule", "key": "node-role.kubernetes.io/master" }It means: "bypass the exact taint that we saw earlier on node1."
Special tolerations
- Check tolerations on
kube-proxy:kubectl -n kube-system get ds kube-proxy -o json |jq .spec.template.spec.tolerations
The result should include:
{ "operator": "Exists" }This one is a special case that means "ignore all taints and run anyway."
Running Traefik on our cluster
We provide a YAML file (
k8s/traefik.yaml) which is essentially the sum of:Traefik's Daemon Set resources (patched with
hostNetworkand tolerations)Traefik's RBAC rules allowing it to watch necessary API objects
- Apply the YAML:kubectl apply -f ~/container.training/k8s/traefik.yaml
Checking that Traefik runs correctly
- If Traefik started correctly, we now have a web server listening on each node
- Check that Traefik is serving 80/tcp:curl localhost
We should get a 404 page not found error.
This is normal: we haven't provided any ingress rule yet.
Setting up DNS
To make our lives easier, we will use nip.io
Check out
http://cheddar.A.B.C.D.nip.io(replacing A.B.C.D with the IP address of
node1)We should get the same
404 page not founderror(meaning that our DNS is "set up properly", so to speak!)
Traefik web UI
Traefik provides a web dashboard
With the current install method, it's listening on port 8080
- Go to
http://node1:8080(replacingnode1with its IP address)
Setting up host-based routing ingress rules
We are going to use
errm/cheeseimages(there are 3 tags available: wensleydale, cheddar, stilton)
These images contain a simple static HTTP server sending a picture of cheese
We will run 3 deployments (one for each cheese)
We will create 3 services (one for each deployment)
Then we will create 3 ingress rules (one for each service)
We will route
<name-of-cheese>.A.B.C.D.nip.ioto the corresponding deployment
Running cheesy web servers
Run all three deployments:
kubectl create deployment cheddar --image=errm/cheese:cheddarkubectl create deployment stilton --image=errm/cheese:stiltonkubectl create deployment wensleydale --image=errm/cheese:wensleydaleCreate a service for each of them:
kubectl expose deployment cheddar --port=80kubectl expose deployment stilton --port=80kubectl expose deployment wensleydale --port=80
What does an ingress resource look like?
Here is a minimal host-based ingress resource:
apiVersion: networking.k8s.io/v1beta1kind: Ingressmetadata: name: cheddarspec: rules: - host: cheddar.A.B.C.D.nip.io http: paths: - path: / backend: serviceName: cheddar servicePort: 80(It is in k8s/ingress.yaml.)
Creating our first ingress resources
Edit the file
~/container.training/k8s/ingress.yamlReplace A.B.C.D with the IP address of
node1Apply the file
(An image of a piece of cheese should show up.)
Creating the other ingress resources
Edit the file
~/container.training/k8s/ingress.yamlReplace
cheddarwithstilton(inname,host,serviceName)Apply the file
Check that
stilton.A.B.C.D.nip.ioworks correctlyRepeat for
wensleydale
Using multiple ingress controllers
You can have multiple ingress controllers active simultaneously
(e.g. Traefik and NGINX)
You can even have multiple instances of the same controller
(e.g. one for internal, another for external traffic)
To indicate which ingress controller should be used by a given Ingress resouce:
before Kubernetes 1.18, use the
kubernetes.io/ingress.classannotationsince Kubernetes 1.18, use the
ingressClassNamefield
(which should refer to an existingIngressClassresource)
Ingress: the good
The traffic flows directly from the ingress load balancer to the backends
it doesn't need to go through the
ClusterIPin fact, we don't even need a
ClusterIP(we can use a headless service)
The load balancer can be outside of Kubernetes
(as long as it has access to the cluster subnet)
This allows the use of external (hardware, physical machines...) load balancers
Annotations can encode special features
(rate-limiting, A/B testing, session stickiness, etc.)
Ingress: the bad
Aforementioned "special features" are not standardized yet
Some controllers will support them; some won't
Even relatively common features (stripping a path prefix) can differ:
The Ingress spec stabilized in Kubernetes 1.19 ...
... without specifying these features! 😭
A special feature in action
We're going to see how to implement canary releases with Traefik
This feature is available on multiple ingress controllers
... But it is configured very differently on each of them
Canary releases
A canary release (or canary launch or canary deployment) is a release that will process only a small fraction of the workload
After deploying the canary, we compare its metrics to the normal release
If the metrics look good, the canary will progressively receive more traffic
(until it gets 100% and becomes the new normal release)
If the metrics aren't good, the canary is automatically removed
When we deploy a bad release, only a tiny fraction of traffic is affected
Various ways to implement canary
Example 1: canary for a microservice
- 1% of all requests (sampled randomly) are sent to the canary
- the remaining 99% are sent to the normal release
Example 2: canary for a web app
- 1% of users are sent to the canary web site
- the remaining 99% are sent to the normal release
Example 3: canary for shipping physical goods
- 1% of orders are shipped with the canary process
- the remaining 99% are shipped with the normal process
We're going to implement example 1 (per-request routing)
Canary releases with Traefik
We need to deploy the canary and expose it with a separate service
Then, in the Ingress resource, we need:
multiple
pathsentries (one for each service, canary and normal)an extra annotation indicating the weight of each service
If we want, we can send requests to more than 2 services
Let's send requests to our 3 cheesy services!
- Create the resource shown on the next slide
The Ingress resource
apiVersion: networking.k8s.io/v1beta1kind: Ingressmetadata: name: cheeseplate annotations: traefik.ingress.kubernetes.io/service-weights: | cheddar: 50% wensleydale: 25% stilton: 25%spec: rules: - host: cheeseplate.A.B.C.D.nip.io http: paths: - path: / backend: serviceName: cheddar servicePort: 80 - path: / backend: serviceName: wensleydale servicePort: 80 - path: / backend: serviceName: stilton servicePort: 80Testing the canary
- Let's check the percentage of requests going to each service
- Continuously send HTTP requests to the new ingress:while sleep 0.1; docurl -s http://cheeseplate.A.B.C.D.nip.io/done
We should see a 50/25/25 request mix.
Load balancing fairness
Note: if we use odd request ratios, the load balancing algorithm might appear to be broken on a small scale (when sending a small number of requests), but on a large scale (with many requests) it will be fair.
For instance, with a 11%/89% ratio, we can see 79 requests going to the 89%-weighted service, and then requests alternating between the two services; then 79 requests again, etc.
Other ingress controllers
Just to illustrate how different things are ...
With the NGINX ingress controller:
define two ingress ressources
(specifying rules with the same host+path)add
nginx.ingress.kubernetes.io/canaryannotations on each
With Linkerd2:
define two services
define an extra service for the weighted aggregate of the two
define a TrafficSplit (this is a CRD introduced by the SMI spec)
We need more than that
What we saw is just one of the multiple building blocks that we need to achieve a canary release.
We also need:
metrics (latency, performance ...) for our releases
automation to alter canary weights
(increase canary weight if metrics look good; decrease otherwise)
a mechanism to manage the lifecycle of the canary releases
(create them, promote them, delete them ...)
For inspiration, check flagger by Weave.
:EN:- The Ingress resource :FR:- La ressource ingress
Ingress and TLS certificates
(automatically generated title slide)
Ingress and TLS certificates
Most ingress controllers support TLS connections
(in a way that is standard across controllers)
The TLS key and certificate are stored in a Secret
The Secret is then referenced in the Ingress resource:
spec:tls:- secretName: XXXhosts:- YYYrules:- ZZZ
Obtaining a certificate
In the next section, we will need a TLS key and certificate
These usually come in PEM format:
-----BEGIN CERTIFICATE-----MIIDATCCAemg......-----END CERTIFICATE-----We will see how to generate a self-signed certificate
(easy, fast, but won't be recognized by web browsers)
We will also see how to obtain a certificate from Let's Encrypt
(requires the cluster to be reachable through a domain name)
In production ...
A very popular option is to use the cert-manager operator
It's a flexible, modular approach to automated certificate management
For simplicity, in this section, we will use certbot
The method shown here works well for one-time certs, but lacks:
automation
renewal
Which domain to use
If you're doing this in a training:
the instructor will tell you what to use
If you're doing this on your own Kubernetes cluster:
you should use a domain that points to your cluster
More precisely:
you should use a domain that points to your ingress controller
If you don't have a domain name, you can use nip.io
(if your ingress controller is on 1.2.3.4, you can use
whatever.1.2.3.4.nip.io)
Setting $DOMAIN
We will use
$DOMAINin the following sectionLet's set it now
- Set the
DOMAINenvironment variable:export DOMAIN=...
Method 1, self-signed certificate
- Thanks to
openssl, generating a self-signed cert is just one command away!
- Generate a key and certificate:openssl req \-newkey rsa -nodes -keyout privkey.pem \-x509 -days 30 -subj /CN=$DOMAIN/ -out cert.pem
This will create two files, privkey.pem and cert.pem.
Method 2, Let's Encrypt with certbot
certbotis an ACME client(Automatic Certificate Management Environment)
We can use it to obtain certificates from Let's Encrypt
It needs to listen to port 80
(to complete the HTTP-01 challenge)
If port 80 is already taken by our ingress controller, see method 3
HTTP-01 challenge
certbotcontacts Let's Encrypt, asking for a cert for$DOMAINLet's Encrypt gives a token to
certbotLet's Encrypt then tries to access the following URL:
http://$DOMAIN/.well-known/acme-challenge/<token>That URL needs to be routed to
certbotOnce Let's Encrypt gets the response from
certbot, it issues the certificate
Running certbot
There is a very convenient container image,
certbot/certbotLet's use a volume to get easy access to the generated key and certificate
- Obtain a certificate from Let's Encrypt:EMAIL=your.address@example.comdocker run --rm -p 80:80 -v $PWD/letsencrypt:/etc/letsencrypt \certbot/certbot certonly \-m $EMAIL \--standalone --agree-tos -n \--domain $DOMAIN \--test-cert
This will get us a "staging" certificate.
Remove --test-cert to obtain a real certificate.
Copying the key and certificate
If everything went fine:
the key and certificate files are in
letsencrypt/live/$DOMAINthey are owned by
root
Grant ourselves permissions on these files:
sudo chown -R $USER letsencryptCopy the certificate and key to the current directory:
cp letsencrypt/live/test/{cert,privkey}.pem .
Method 3, certbot with Ingress
Sometimes, we can't simply listen to port 80:
- we might already have an ingress controller there
- our nodes might be on an internal network
But we can define an Ingress to route the HTTP-01 challenge to
certbot!Our Ingress needs to route all requests to
/.well-known/acme-challengetocertbotThere are at least two ways to do that:
- run
certbotin a Pod (and extract the cert+key when it's done) - run
certbotin a container on a node (and manually route traffic to it)
- run
We're going to use the second option
(mostly because it will give us an excuse to tinker with Endpoints resources!)
The plan
We need the following resources:
an Endpoints¹ listing a hard-coded IP address and port
(where ourcertbotcontainer will be listening)a Service corresponding to that Endpoints
an Ingress sending requests to
/.well-known/acme-challenge/*to that Service
(we don't even need to include a domain name in it)
Then we need to start
certbotso that it's listening on the right address+port
¹Endpoints is always plural, because even a single resource is a list of endpoints.
Creating resources
We prepared a YAML file to create the three resources
However, the Endpoints needs to be adapted to put the current node's address
Edit
~/containers.training/k8s/certbot.yaml(replace
A.B.C.Dwith the current node's address)Create the resources:
kubectl apply -f ~/containers.training/k8s/certbot.yaml
Obtaining the certificate
Now we can run
certbot, listening on the port listed in the Endpoints(i.e. 8000)
- Run
certbot:EMAIL=your.address@example.comdocker run --rm -p 8000:80 -v $PWD/letsencrypt:/etc/letsencrypt \certbot/certbot certonly \-m $EMAIL \--standalone --agree-tos -n \--domain $DOMAIN \--test-cert
This is using the staging environment.
Remove --test-cert to get a production certificate.
Copying the certificate
Just like in the previous method, the certificate is in
letsencrypt/live/$DOMAIN(and owned by root)
Grand ourselves permissions on these files:
sudo chown -R $USER letsencryptCopy the certificate and key to the current directory:
cp letsencrypt/live/$DOMAIN/{cert,privkey}.pem .
Creating the Secret
We now have two files:
privkey.pem(the private key)cert.pem(the certificate)
We can create a Secret to hold them
- Create the Secret:kubectl create secret tls $DOMAIN --cert=cert.pem --key=privkey.pem
Ingress with TLS
To enable TLS for an Ingress, we need to add a
tlssection to the Ingress:spec:tls:- secretName: DOMAINhosts:- DOMAINrules: ...The list of hosts will be used by the ingress controller
(to know which certificate to use with SNI)
Of course, the name of the secret can be different
(here, for clarity and convenience, we set it to match the domain)
About the ingress controller
Many ingress controllers can use different "stores" for keys and certificates
Our ingress controller needs to be configured to use secrets
(as opposed to, e.g., obtain certificates directly with Let's Encrypt)
Using the certificate
Edit the Ingress manifest,
~/container.training/k8s/ingress.yamlUncomment the
tlssectionUpdate the
secretNameandhostslistCreate or update the Ingress:
kubectl apply -f ~/container.training/k8s/ingress.yamlCheck that the URL now works over
https(it might take a minute to be picked up by the ingress controller)
Discussion
To repeat something mentioned earlier ...
The methods presented here are for educational purpose only
In most production scenarios, the certificates will be obtained automatically
A very popular option is to use the cert-manager operator
:EN:- Ingress and TLS :FR:- Certificats TLS et ingress
cert-manager
(automatically generated title slide)
cert-manager
cert-manager¹ facilitates certificate signing through the Kubernetes API:
we create a Certificate object (that's a CRD)
cert-manager creates a private key
it signs that key ...
... or interacts with a certificate authority to obtain the signature
it stores the resulting key+cert in a Secret resource
These Secret resources can be used in many places (Ingress, mTLS, ...)
¹Always lower case, words separated with a dash; see the style guide
Getting signatures
cert-manager can use multiple Issuers (another CRD), including:
self-signed
cert-manager acting as a CA
the ACME protocol (notably used by Let's Encrypt)
Multiple issuers can be configured simultaneously
Issuers can be available in a single namespace, or in the whole cluster
(then we use the ClusterIssuer CRD)
cert-manager in action
We will install cert-manager
We will create a ClusterIssuer to obtain certificates with Let's Encrypt
(this will involve setting up an Ingress Controller)
We will create a Certificate request
cert-manager will honor that request and create a TLS Secret
Installing cert-manager
- It can be installed with a YAML manifest, or with Helm
- Let's install the cert-manager Helm chart with this one-liner:helm install cert-manager cert-manager \--repo https://charts.jetstack.io \--create-namespace --namespace cert-manager \--set installCRDs=true
If you prefer to install with a single YAML file, that's fine too!
(see the documentation for instructions)
ClusterIssuer manifest
apiVersion: cert-manager.io/v1kind: ClusterIssuermetadata: name: letsencrypt-stagingspec: acme: # Remember to update this if you use this manifest to obtain real certificates :) email: hello@example.com server: https://acme-staging-v02.api.letsencrypt.org/directory # To use the production environment, use the following line instead: #server: https://acme-v02.api.letsencrypt.org/directory privateKeySecretRef: name: issuer-letsencrypt-staging solvers: - http01: ingress: class: traefikCreating the ClusterIssuer
- The manifest shown on the previous slide is in k8s/cm-clusterissuer.yaml
- Create the ClusterIssuer:kubectl apply -f ~/container.training/k8s/cm-clusterissuer.yaml
Certificate manifest
apiVersion: cert-manager.io/v1kind: Certificatemetadata: name: xyz.A.B.C.D.nip.iospec: secretName: xyz.A.B.C.D.nip.io dnsNames: - xyz.A.B.C.D.nip.io issuerRef: name: letsencrypt-staging kind: ClusterIssuerThe
name,secretName, anddnsNamesdon't have to matchThere can be multiple
dnsNamesThe
issuerRefmust match the ClusterIssuer that we created earlier
Creating the Certificate
- The manifest shown on the previous slide is in k8s/cm-certificate.yaml
Edit the Certificate to update the domain name
(make sure to replace A.B.C.D with the IP address of one of your nodes!)
Create the Certificate:
kubectl apply -f ~/container.training/k8s/cm-certificate.yaml
What's happening?
cert-manager will create:
the secret key
a Pod, a Service, and an Ingress to complete the HTTP challenge
then it waits for the challenge to complete
- View the resources created by cert-manager:kubectl get pods,services,ingresses \--selector=acme.cert-manager.io/http01-solver=true
HTTP challenge
The CA (in this case, Let's Encrypt) will fetch a particular URL:
http://<our-domain>/.well-known/acme-challenge/<token>
- Check the path of the Ingress in particular:kubectl describe ingress--selector=acme.cert-manager.io/http01-solver=true
What's missing ?
What's missing ?
An Ingress Controller! 😅
Install an Ingress Controller:
kubectl apply -f ~/container.training/k8s/traefik-v2.yamlWait a little bit, and check that we now have a
kubernetes.io/tlsSecret:kubectl get secrets
Using the secret
For bonus points, try to use the secret in an Ingress!
This is what the manifest would look like:
apiVersion: networking.k8s.io/v1beta1kind: Ingressmetadata: name: xyzspec: tls: - secretName: xyz.A.B.C.D.nip.io hosts: - xyz.A.B.C.D.nip.io rules: ...Automatic TLS Ingress with annotations
It is also possible to annotate Ingress resources for cert-manager
If we annotate an Ingress resource with
cert-manager.io/cluster-issuer=xxx:cert-manager will detect that annotation
it will obtain a certificate using the specified ClusterIssuer (
xxx)it will store the key and certificate in the specified Secret
Note: the Ingress still needs the
tlssection withsecretNameandhosts
Let's Encrypt and nip.io
Let's Encrypt has rate limits per domain
(the limits only apply to the production environment, not staging)
There is a limit of 50 certificates per registered domain
If we try to use the production environment, we will probably hit the limit
It's fine to use the staging environment for these experiments
(our certs won't validate in a browser, but we can always check the details of the cert to verify that it was issued by Let's Encrypt!)
:EN:- Obtaining certificates with cert-manager :FR:- Obtenir des certificats avec cert-manager
:T: Obtaining TLS certificates with cert-manager
Kustomize
(automatically generated title slide)
Kustomize
Kustomize lets us transform Kubernetes resources:
YAML + kustomize → new YAML
Starting point = valid resource files
(i.e. something that we could load with
kubectl apply -f)Recipe = a kustomization file
(describing how to transform the resources)
Result = new resource files
(that we can load with
kubectl apply -f)
Pros and cons
Relatively easy to get started
(just get some existing YAML files)
Easy to leverage existing "upstream" YAML files
(or other kustomizations)
Somewhat integrated with
kubectl(but only "somewhat" because of version discrepancies)
Less complex than e.g. Helm, but also less powerful
No central index like the Artifact Hub (but is there a need for it?)
Kustomize in a nutshell
Get some valid YAML (our "resources")
Write a kustomization (technically, a file named
kustomization.yaml)reference our resources
reference other kustomizations
add some patches
...
Use that kustomization either with
kustomize buildorkubectl apply -kWrite new kustomizations referencing the first one to handle minor differences
A simple kustomization
This features a Deployment, Service, and Ingress (in separate files), and a couple of patches (to change the number of replicas and the hostname used in the Ingress).
apiVersion: kustomize.config.k8s.io/v1beta1kind: KustomizationpatchesStrategicMerge:- scale-deployment.yaml- ingress-hostname.yamlresources:- deployment.yaml- service.yaml- ingress.yamlOn the next slide, let's see a more complex example ...
A more complex Kustomization
apiVersion: kustomize.config.k8s.io/v1beta1kind: KustomizationcommonAnnotations: mood: 😎commonLabels: add-this-to-all-my-resources: pleasenamePrefix: prod-patchesStrategicMerge:- prod-scaling.yaml- prod-healthchecks.yamlbases:- api/- frontend/- db/- github.com/example/app?ref=tag-or-branchresources:- ingress.yaml- permissions.yamlconfigMapGenerator:- name: appconfig files: - global.conf - local.conf=prod.confGlossary
A base is a kustomization that is referred to by other kustomizations
An overlay is a kustomization that refers to other kustomizations
A kustomization can be both a base and an overlay at the same time
(a kustomization can refer to another, which can refer to a third)
A patch describes how to alter an existing resource
(e.g. to change the image in a Deployment; or scaling parameters; etc.)
A variant is the final outcome of applying bases + overlays
(See the kustomize glossary for more definitions!)
What Kustomize cannot do
By design, there are a number of things that Kustomize won't do
For instance:
using command-line arguments or environment variables to generate a variant
overlays can only add resources, not remove them
See the full list of eschewed features for more details
Kustomize workflows
The Kustomize documentation proposes two different workflows
Bespoke configuration
- base and overlays managed by the same team
Off-the-shelf configuration (OTS)
base and overlays managed by different teams
base is regularly updated by "upstream" (e.g. a vendor)
our overlays and patches should (hopefully!) apply cleanly
we may regularly update the base, or use a remote base
Remote bases
Kustomize can also use bases that are remote git repositories
Examples:
github.com/jpetazzo/kubercoins (remote git repository)
github.com/jpetazzo/kubercoins?ref=kustomize (specific tag or branch)
Note that this only works for kustomizations, not individual resources
(the specified repository or directory must contain a
kustomization.yamlfile)
Hashicorp go-getter
Some versions of Kustomize support additional forms for remote resources
Examples:
https://releases.hello.io/k/1.0.zip (remote archive)
https://releases.hello.io/k/1.0.zip//some-subdir (subdirectory in archive)
This relies on hashicorp/go-getter
... But it prevents Kustomize inclusion in
kubectlAvoid them!
See kustomize#3578 for details
Managing kustomization.yaml
There are many ways to manage
kustomization.yamlfiles, including:web wizards like Replicated Ship
the
kustomizeCLIopening the file with our favorite text editor
Let's see these in action!
An easy way to get started with Kustomize
We are going to use Replicated Ship to experiment with Kustomize
The Replicated Ship CLI has been installed on our clusters
Replicated Ship has multiple workflows; here is what we will do:
initialize a Kustomize overlay from a remote GitHub repository
customize some values using the web UI provided by Ship
look at the resulting files and apply them to the cluster
Getting started with Ship
We need to run
ship initin a new directoryship initrequires a URL to a remote repository containing Kubernetes YAMLIt will clone that repository and start a web UI
Later, it can watch that repository and/or update from it
We will use the jpetazzo/kubercoins repository
(it contains all the DockerCoins resources as YAML files)
ship init
Change to a new directory:
mkdir ~/kustomcoinscd ~/kustomcoinsRun
ship initwith the kustomcoins repository:ship init https://github.com/jpetazzo/kubercoins
Access the web UI
ship inittells us to connect onlocalhost:8800We need to replace
localhostwith the address of our node(since we run on a remote machine)
Follow the steps in the web UI, and change one parameter
(e.g. set the number of replicas in the worker Deployment)
Complete the web workflow, and go back to the CLI
Inspect the results
Look at the content of our directory
basecontains the kubercoins repository + akustomization.yamlfileoverlays/shipcontains the Kustomize overlay referencing the base + our patch(es)rendered.yamlis a YAML bundle containing the patched application.shipcontains a state file used by Ship
Using the results
We can
kubectl apply -f rendered.yaml(on any version of Kubernetes)
Starting with Kubernetes 1.14, we can apply the overlay directly with:
kubectl apply -k overlays/shipBut let's not do that for now!
We will create a new copy of DockerCoins in another namespace
Deploy DockerCoins with Kustomize
Create a new namespace:
kubectl create namespace kustomcoinsDeploy DockerCoins:
kubectl apply -f rendered.yaml --namespace=kustomcoinsOr, with Kubernetes 1.14, we can also do this:
kubectl apply -k overlays/ship --namespace=kustomcoins
Checking our new copy of DockerCoins
- We can check the worker logs, or the web UI
Retrieve the NodePort number of the web UI:
kubectl get service webui --namespace=kustomcoinsOpen it in a web browser
Look at the worker logs:
kubectl logs deploy/worker --tail=10 --follow --namespace=kustomcoins
Note: it might take a minute or two for the worker to start.
Working with the kustomize CLI
This is another way to get started
General workflow:
kustomize createto generate an emptykustomization.yamlfilekustomize edit add resourceto add Kubernetes YAML files to itkustomize edit add patchto add patches to said resourceskustomize build | kubectl apply -f-orkubectl apply -k .
kubectl integration
Kustomize has been integrated in
kubectl(since Kubernetes 1.14)kubectl kustomizecan apply a kustomizationcommands that use
-fcan also use-k(kubectl apply/delete/...)
The
kustomizetool is still needed if we want to usecreate,edit, ...Kubernetes 1.14 to 1.20 uses Kustomize 2.0.3
Kubernetes 1.21 jumps to Kustomize 4.1.2
Future versions should track Kustomize updates more closely
Differences between 2.0.3 and later
Kustomize 2.1 / 3.0 deprecates
bases(they should be listed inresources)(this means that "modern"
kustomize edit add resourcewon't work with "old"kubectl apply -k)Kustomize 2.1 introduces
replicasandenvsKustomize 3.1 introduces multipatches
Kustomize 3.2 introduce inline patches in
kustomization.yamlKustomize 3.3 to 3.10 is mostly internal refactoring
Kustomize 4.0 drops go-getter again
Kustomize 4.1 allows patching kind and name
Scaling
Instead of using a patch, scaling can be done like this:
apiVersion: kustomize.config.k8s.io/v1beta1kind: Kustomization...replicas:- name: worker count: 5It will automatically work with Deployments, ReplicaSets, StatefulSets.
(For other resource types, fall back to a patch.)
Updating images
Instead of using patches, images can be changed like this:
apiVersion: kustomize.config.k8s.io/v1beta1kind: Kustomization...images:- name: postgres newName: harbor.enix.io/my-postgres- name: dockercoins/worker newTag: v0.2- name: dockercoins/hasher newName: registry.dockercoins.io/hasher newTag: v0.2- name: alpine digest: sha256:24a0c4b4a4c0eb97a1aabb8e29f18e917d05abfe1b7a7c07857230879ce7d3d3Updating images, pros and cons
Very convenient when the same image appears multiple times
Very convenient to define tags (or pin to hashes) outside of the main YAML
Doesn't support wildcard or generic substitutions:
cannot "replace
dockercoins/*withghcr.io/dockercoins/*"cannot "tag all
dockercoins/*withv0.2"
Only patches "well-known" image fields (won't work with CRDs referencing images)
Helm can deal with these scenarios, for instance:
image: {{ .Values.registry }}/worker:{{ .Values.version }}
Advanced resource patching
The example below shows how to:
- patch multiple resources with a selector (new in Kustomize 3.1)
- use an inline patch instead of a separate patch file (new in Kustomize 3.2)
apiVersion: kustomize.config.k8s.io/v1beta1kind: Kustomization...patches:- patch: |- - op: replace path: /spec/template/spec/containers/0/image value: alpine target: kind: Deployment labelSelector: "app"(This replaces all images of Deployments matching the app selector with alpine.)
Advanced resource patching, pros and cons
Very convenient to patch an arbitrary number of resources
Very convenient to patch any kind of resource, including CRDs
Doesn't support "fine-grained" patching (e.g. image registry or tag)
Once again, Helm can do it:
image: {{ .Values.registry }}/worker:{{ .Values.version }}
Differences with Helm
Helm charts generally require more upfront work
(while kustomize "bases" are standard Kubernetes YAML)
... But Helm charts are also more powerful; their templating language can:
conditionally include/exclude resources or blocks within resources
generate values by concatenating, hashing, transforming parameters
generate values or resources by iteration (
{{ range ... }})access the Kubernetes API during template evaluation
:EN:- Packaging and running apps with Kustomize :FR:- Packaging d'applications avec Kustomize
Managing stacks with Helm
(automatically generated title slide)
Managing stacks with Helm
Helm is a (kind of!) package manager for Kubernetes
We can use it to:
find existing packages (called "charts") created by other folks
install these packages, configuring them for our particular setup
package our own things (for distribution or for internal use)
manage the lifecycle of these installs (rollback to previous version etc.)
It's a "CNCF graduate project", indicating a certain level of maturity
(more on that later)
From kubectl run to YAML
We can create resources with one-line commands
(
kubectl run,kubectl createa deployment,kubectl expose...)We can also create resources by loading YAML files
(with
kubectl apply -f,kubectl create -f...)There can be multiple resources in a single YAML files
(making them convenient to deploy entire stacks)
However, these YAML bundles often need to be customized
(e.g.: number of replicas, image version to use, features to enable...)
Beyond YAML
Very often, after putting together our first
app.yaml, we end up with:app-prod.yamlapp-staging.yamlapp-dev.yamlinstructions indicating to users "please tweak this and that in the YAML"
That's where using something like CUE, Kustomize, or Helm can help!
Now we can do something like this:
helm install app ... --set this.parameter=that.value
Other features of Helm
With Helm, we create "charts"
These charts can be used internally or distributed publicly
Public charts can be indexed through the Artifact Hub
This gives us a way to find and install other folks' charts
Helm also gives us ways to manage the lifecycle of what we install:
keep track of what we have installed
upgrade versions, change parameters, roll back, uninstall
Furthermore, even if it's not "the" standard, it's definitely "a" standard!
CNCF graduation status
On April 30th 2020, Helm was the 10th project to graduate within the CNCF
🎉
(alongside Containerd, Prometheus, and Kubernetes itself)
This is an acknowledgement by the CNCF for projects that
demonstrate thriving adoption, an open governance process,
and a strong commitment to community, sustainability, and inclusivity.See CNCF announcement and Helm announcement
Helm concepts
helmis a CLI toolIt is used to find, install, upgrade charts
A chart is an archive containing templatized YAML bundles
Charts are versioned
Charts can be stored on private or public repositories
Differences between charts and packages
A package (deb, rpm...) contains binaries, libraries, etc.
A chart contains YAML manifests
(the binaries, libraries, etc. are in the images referenced by the chart)
On most distributions, a package can only be installed once
(installing another version replaces the installed one)
A chart can be installed multiple times
Each installation is called a release
This allows to install e.g. 10 instances of MongoDB
(with potentially different versions and configurations)
Wait a minute ...
But, on my Debian system, I have Python 2 and Python 3.
Also, I have multiple versions of the Postgres database engine!
Yes!
But they have different package names:
python2.7,python3.8postgresql-10,postgresql-11
Good to know: the Postgres package in Debian includes
provisions to deploy multiple Postgres servers on the
same system, but it's an exception (and it's a lot of
work done by the package maintainer, not by the dpkg
or apt tools).
Helm 2 vs Helm 3
Helm 3 was released November 13, 2019
Charts remain compatible between Helm 2 and Helm 3
The CLI is very similar (with minor changes to some commands)
The main difference is that Helm 2 uses
tiller, a server-side componentHelm 3 doesn't use
tillerat all, making it simpler (yay!)
With or without tiller
With Helm 3:
the
helmCLI communicates directly with the Kubernetes APIit creates resources (deployments, services...) with our credentials
With Helm 2:
the
helmCLI communicates withtiller, tellingtillerwhat to dotillerthen communicates with the Kubernetes API, using its own credentials
This indirect model caused significant permissions headaches
(
tillerrequired very broad permissions to function)tillerwas removed in Helm 3 to simplify the security aspects
Installing Helm
- If the
helmCLI is not installed in your environment, install it
Check if
helmis installed:helmIf it's not installed, run the following command:
curl https://raw.githubusercontent.com/kubernetes/helm/master/scripts/get-helm-3 \| bash
(To install Helm 2, replace get-helm-3 with get.)
Only if using Helm 2 ...
We need to install Tiller and give it some permissions
Tiller is composed of a service and a deployment in the
kube-systemnamespaceThey can be managed (installed, upgraded...) with the
helmCLI
- Deploy Tiller:helm init
At the end of the install process, you will see:
Happy Helming!Only if using Helm 2 ...
Tiller needs permissions to create Kubernetes resources
In a more realistic deployment, you might create per-user or per-team service accounts, roles, and role bindings
- Grant
cluster-adminrole tokube-system:defaultservice account:kubectl create clusterrolebinding add-on-cluster-admin \--clusterrole=cluster-admin --serviceaccount=kube-system:default
(Defining the exact roles and permissions on your cluster requires a deeper knowledge of Kubernetes' RBAC model. The command above is fine for personal and development clusters.)
Charts and repositories
A repository (or repo in short) is a collection of charts
It's just a bunch of files
(they can be hosted by a static HTTP server, or on a local directory)
We can add "repos" to Helm, giving them a nickname
The nickname is used when referring to charts on that repo
(for instance, if we try to install
hello/world, that means the chartworldon the repohello; and that repohellomight be something like https://blahblah.hello.io/charts/)
How to find charts, the old way
Helm 2 came with one pre-configured repo, the "stable" repo
(located at https://charts.helm.sh/stable)
Helm 3 doesn't have any pre-configured repo
The "stable" repo mentioned above is now being deprecated
The new approach is to have fully decentralized repos
Repos can be indexed in the Artifact Hub
(which supersedes the Helm Hub)
How to find charts, the new way
Go to the Artifact Hub (https://artifacthub.io)
Or use
helm search hub ...from the CLILet's try to find a Helm chart for something called "OWASP Juice Shop"!
(it is a famous demo app used in security challenges)
Finding charts from the CLI
- We can use
helm search hub <keyword>
Look for the OWASP Juice Shop app:
helm search hub owasp juiceSince the URLs are truncated, try with the YAML output:
helm search hub owasp juice -o yaml
Then go to → https://artifacthub.io/packages/helm/seccurecodebox/juice-shop
Finding charts on the web
- We can also use the Artifact Hub search feature
Go to https://artifacthub.io/
In the search box on top, enter "owasp juice"
Click on the "juice-shop" result (not "multi-juicer" or "juicy-ctf")
Installing the chart
- Click on the "Install" button, it will show instructions
First, add the repository for that chart:
helm repo add juice https://charts.securecodebox.ioThen, install the chart:
helm install my-juice-shop juice/juice-shop
Note: it is also possible to install directly a chart, with --repo https://...
Charts and releases
"Installing a chart" means creating a release
In the previous exemple, the release was named "my-juice-shop"
We can also use
--generate-nameto ask Helm to generate a name for us
List the releases:
helm listCheck that we have a
my-juice-shop-...Pod up and running:kubectl get pods
Searching and installing with Helm 2
Helm 2 doesn't have support for the Helm Hub
The
helm searchcommand only takes a search string argument(e.g.
helm search juice-shop)With Helm 2, the name is optional:
helm install juice/juice-shopwill automatically generate a namehelm install --name my-juice-shop juice/juice-shopwill specify a name
Viewing resources of a release
This specific chart labels all its resources with a
releaselabelWe can use a selector to see these resources
- List all the resources created by this release:kubectl get all --selector=app.kubernetes.io/instance=my-juice-shop
Note: this label wasn't added automatically by Helm.
It is defined in that chart. In other words, not all charts will provide this label.
Configuring a release
By default,
juice/juice-shopcreates a service of typeClusterIPWe would like to change that to a
NodePortWe could use
kubectl edit service my-juice-shop, but ...... our changes would get overwritten next time we update that chart!
Instead, we are going to set a value
Values are parameters that the chart can use to change its behavior
Values have default values
Each chart is free to define its own values and their defaults
Checking possible values
- We can inspect a chart with
helm showorhelm inspect
Look at the README for the app:
helm show readme juice/juice-shopLook at the values and their defaults:
helm show values juice/juice-shop
The values may or may not have useful comments.
The readme may or may not have (accurate) explanations for the values.
(If we're unlucky, there won't be any indication about how to use the values!)
Setting values
Values can be set when installing a chart, or when upgrading it
We are going to update
my-juice-shopto change the type of the service
- Update
my-juice-shop:helm upgrade my-juice-shop juice/my-juice-shop \--set service.type=NodePort
Note that we have to specify the chart that we use (juice/my-juice-shop),
even if we just want to update some values.
We can set multiple values. If we want to set many values, we can use -f/--values and pass a YAML file with all the values.
All unspecified values will take the default values defined in the chart.
Connecting to the Juice Shop
- Let's check the app that we just installed
Check the node port allocated to the service:
kubectl get service my-juice-shopPORT=$(kubectl get service my-juice-shop -o jsonpath={..nodePort})Connect to it:
curl localhost:$PORT/
:EN:- Helm concepts :EN:- Installing software with Helm :EN:- Helm 2, Helm 3, and the Helm Hub
:FR:- Fonctionnement général de Helm :FR:- Installer des composants via Helm :FR:- Helm 2, Helm 3, et le Helm Hub
:T: Getting started with Helm and its concepts
:Q: Which comparison is the most adequate? :A: Helm is a firewall, charts are access lists :A: ✔️Helm is a package manager, charts are packages :A: Helm is an artefact repository, charts are artefacts :A: Helm is a CI/CD platform, charts are CI/CD pipelines
:Q: What's required to distribute a Helm chart? :A: A Helm commercial license :A: A Docker registry :A: An account on the Helm Hub :A: ✔️An HTTP server
Helm chart format
(automatically generated title slide)
Helm chart format
What exactly is a chart?
What's in it?
What would be involved in creating a chart?
(we won't create a chart, but we'll see the required steps)
What is a chart
A chart is a set of files
Some of these files are mandatory for the chart to be viable
(more on that later)
These files are typically packed in a tarball
These tarballs are stored in "repos"
(which can be static HTTP servers)
We can install from a repo, from a local tarball, or an unpacked tarball
(the latter option is preferred when developing a chart)
What's in a chart
A chart must have at least:
a
templatesdirectory, with YAML manifests for Kubernetes resourcesa
values.yamlfile, containing (tunable) parameters for the charta
Chart.yamlfile, containing metadata (name, version, description ...)
Let's look at a simple chart for a basic demo app
Adding the repo
- If you haven't done it before, you need to add the repo for that chart
- Add the repo that holds the chart for the OWASP Juice Shop:helm repo add juice https://charts.securecodebox.io
Downloading a chart
- We can use
helm pullto download a chart from a repo
Download the tarball for
juice/juice-shop:helm pull juice/juice-shop(This will create a file named
juice-shop-X.Y.Z.tgz.)Or, download + untar
juice/juice-shop:helm pull juice/juice-shop --untar(This will create a directory named
juice-shop.)
Looking at the chart's content
- Let's look at the files and directories in the
juice-shopchart
- Display the tree structure of the chart we just downloaded:tree juice-shop
We see the components mentioned above: Chart.yaml, templates/, values.yaml.
Templates
The
templates/directory contains YAML manifests for Kubernetes resources(Deployments, Services, etc.)
These manifests can contain template tags
(using the standard Go template library)
- Look at the template file for the Service resource:cat juice-shop/templates/service.yaml
Analyzing the template file
Tags are identified by
{{ ... }}{{ template "x.y" }}expands a named template(previously defined with
{{ define "x.y "}}...stuff...{{ end }})The
.in{{ template "x.y" . }}is the context for that named template(so that the named template block can access variables from the local context)
{{ .Release.xyz }}refers to built-in variables initialized by Helm(indicating the chart name, version, whether we are installing or upgrading ...)
{{ .Values.xyz }}refers to tunable/settable values(more on that in a minute)
Values
Each chart comes with a values file
It's a YAML file containing a set of default parameters for the chart
The values can be accessed in templates with e.g.
{{ .Values.x.y }}(corresponding to field
yin mapxin the values file)The values can be set or overridden when installing or ugprading a chart:
with
--set x.y=z(can be used multiple times to set multiple values)with
--values some-yaml-file.yaml(set a bunch of values from a file)
Charts following best practices will have values following specific patterns
(e.g. having a
servicemap allowing to setservice.typeetc.)
Other useful tags
{{ if x }} y {{ end }}allows to includeyifxevaluates totrue(can be used for e.g. healthchecks, annotations, or even an entire resource)
{{ range x }} y {{ end }}iterates overx, evaluatingyeach time(the elements of
xare assigned to.in the range scope){{- x }}/{{ x -}}will remove whitespace on the left/rightThe whole Sprig library, with additions:
lowerupperquotetrimdefaultb64encb64decsha256sumindenttoYaml...
Pipelines
{{ quote blah }}can also be expressed as{{ blah | quote }}With multiple arguments,
{{ x y z }}can be expressed as{{ z | x y }})Example:
{{ .Values.annotations | toYaml | indent 4 }}transforms the map under
annotationsinto a YAML stringindents it with 4 spaces (to match the surrounding context)
Pipelines are not specific to Helm, but a feature of Go templates
(check the Go text/template documentation for more details and examples)
README and NOTES.txt
At the top-level of the chart, it's a good idea to have a README
It will be viewable with e.g.
helm show readme juice/juice-shopIn the
templates/directory, we can also have aNOTES.txtfileWhen the template is installed (or upgraded),
NOTES.txtis processed too(i.e. its
{{ ... }}tags are evaluated)It gets displayed after the install or upgrade
It's a great place to generate messages to tell the user:
how to connect to the release they just deployed
any passwords or other thing that we generated for them
Additional files
We can place arbitrary files in the chart (outside of the
templates/directory)They can be accessed in templates with
.FilesThey can be transformed into ConfigMaps or Secrets with
AsConfigandAsSecrets(see this example in the Helm docs)
Hooks and tests
We can define hooks in our templates
Hooks are resources annotated with
"helm.sh/hook": NAME-OF-HOOKHook names include
pre-install,post-install,test, and much moreThe resources defined in hooks are loaded at a specific time
Hook execution is synchronous
(if the resource is a Job or Pod, Helm will wait for its completion)
This can be use for database migrations, backups, notifications, smoke tests ...
Hooks named
testare executed only when runninghelm test RELEASE-NAME
:EN:- Helm charts format :FR:- Le format des Helm charts
Creating a basic chart
(automatically generated title slide)
Creating a basic chart
We are going to show a way to create a very simplified chart
In a real chart, lots of things would be templatized
(Resource names, service types, number of replicas...)
Create a sample chart:
helm create dockercoinsMove away the sample templates and create an empty template directory:
mv dockercoins/templates dockercoins/default-templatesmkdir dockercoins/templates
k8s/helm-create-basic-chart.md
Exporting the YAML for our application
The following section assumes that DockerCoins is currently running
If DockerCoins is not running, see next slide
- Create one YAML file for each resource that we need:while read kind name; dokubectl get -o yaml $kind $name > dockercoins/templates/$name-$kind.yamldone <<EOFdeployment workerdeployment hasherdaemonset rngdeployment webuideployment redisservice hasherservice rngservice webuiservice redisEOF
k8s/helm-create-basic-chart.md
Obtaining DockerCoins YAML
- If DockerCoins is not running, we can also obtain the YAML from a public repository
Clone the kubercoins repository:
git clone https://github.com/jpetazzo/kubercoinsCopy the YAML files to the
templates/directory:cp kubercoins/*.yaml dockercoins/templates/
k8s/helm-create-basic-chart.md
Testing our helm chart
- Let's install our helm chart!
(helm install helmcoins dockercoinshelmcoinsis the name of the release;dockercoinsis the local path of the chart)
Testing our helm chart
- Let's install our helm chart!
(helm install helmcoins dockercoinshelmcoinsis the name of the release;dockercoinsis the local path of the chart)
Since the application is already deployed, this will fail:
Error: rendered manifests contain a resource that already exists.Unable to continue with install: existing resource conflict:kind: Service, namespace: default, name: hasherTo avoid naming conflicts, we will deploy the application in another namespace
k8s/helm-create-basic-chart.md
Switching to another namespace
We need create a new namespace
(Helm 2 creates namespaces automatically; Helm 3 doesn't anymore)
We need to tell Helm which namespace to use
Create a new namespace:
kubectl create namespace helmcoinsDeploy our chart in that namespace:
helm install helmcoins dockercoins --namespace=helmcoins
k8s/helm-create-basic-chart.md
Helm releases are namespaced
- Let's try to see the release that we just deployed
- List Helm releases:helm list
Our release doesn't show up!
We have to specify its namespace (or switch to that namespace).
k8s/helm-create-basic-chart.md
Specifying the namespace
- Try again, with the correct namespace
- List Helm releases in
helmcoins:helm list --namespace=helmcoins
k8s/helm-create-basic-chart.md
Checking our new copy of DockerCoins
- We can check the worker logs, or the web UI
Retrieve the NodePort number of the web UI:
kubectl get service webui --namespace=helmcoinsOpen it in a web browser
Look at the worker logs:
kubectl logs deploy/worker --tail=10 --follow --namespace=helmcoins
Note: it might take a minute or two for the worker to start.
k8s/helm-create-basic-chart.md
Discussion, shortcomings
Helm (and Kubernetes) best practices recommend to add a number of annotations
(e.g.
app.kubernetes.io/name,helm.sh/chart,app.kubernetes.io/instance...)Our basic chart doesn't have any of these
Our basic chart doesn't use any template tag
Does it make sense to use Helm in that case?
Yes, because Helm will:
track the resources created by the chart
save successive revisions, allowing us to rollback
Helm docs and Kubernetes docs have details about recommended annotations and labels.
k8s/helm-create-basic-chart.md
Cleaning up
- Let's remove that chart before moving on
- Delete the release (don't forget to specify the namespace):helm delete helmcoins --namespace=helmcoins
:EN:- Writing a basic Helm chart for the whole app :FR:- Écriture d'un chart Helm simplifié
Creating better Helm charts
(automatically generated title slide)
Creating better Helm charts
We are going to create a chart with the helper
helm createThis will give us a chart implementing lots of Helm best practices
(labels, annotations, structure of the
values.yamlfile ...)We will use that chart as a generic Helm chart
We will use it to deploy DockerCoins
Each component of DockerCoins will have its own release
In other words, we will "install" that Helm chart multiple times
(one time per component of DockerCoins)
k8s/helm-create-better-chart.md
Creating a generic chart
Rather than starting from scratch, we will use
helm createThis will give us a basic chart that we will customize
- Create a basic chart:cd ~helm create helmcoins
This creates a basic chart in the directory helmcoins.
k8s/helm-create-better-chart.md
What's in the basic chart?
The basic chart will create a Deployment and a Service
Optionally, it will also include an Ingress
If we don't pass any values, it will deploy the
nginximageWe can override many things in that chart
Let's try to deploy DockerCoins components with that chart!
k8s/helm-create-better-chart.md
Writing values.yaml for our components
We need to write one
values.yamlfile for each component(hasher, redis, rng, webui, worker)
We will start with the
values.yamlof the chart, and remove what we don't needWe will create 5 files:
hasher.yaml, redis.yaml, rng.yaml, webui.yaml, worker.yaml
In each file, we want to have:
image:repository: IMAGE-REPOSITORY-NAMEtag: IMAGE-TAG
k8s/helm-create-better-chart.md
Getting started
For component X, we want to use the image dockercoins/X:v0.1
(for instance, for rng, we want to use the image dockercoins/rng:v0.1)
Exception: for redis, we want to use the official image redis:latest
- Write YAML files for the 5 components, with the following model:image:repository: IMAGE-REPOSITORY-NAME (e.g. dockercoins/worker)tag: IMAGE-TAG (e.g. v0.1)
k8s/helm-create-better-chart.md
Deploying DockerCoins components
- For convenience, let's work in a separate namespace
Create a new namespace (if it doesn't already exist):
kubectl create namespace helmcoinsSwitch to that namespace:
kns helmcoins
k8s/helm-create-better-chart.md
Deploying the chart
To install a chart, we can use the following command:
helm install COMPONENT-NAME CHART-DIRECTORYWe can also use the following command, which is idempotent:
helm upgrade COMPONENT-NAME CHART-DIRECTORY --install
- Install the 5 components of DockerCoins:for COMPONENT in hasher redis rng webui worker; dohelm upgrade $COMPONENT helmcoins --install --values=$COMPONENT.yamldone
k8s/helm-create-better-chart.md
"Idempotent"
Idempotent = that can be applied multiple times without changing the result
(the word is commonly used in maths and computer science)
In this context, this means:
if the action (installing the chart) wasn't done, do it
if the action was already done, don't do anything
Ideally, when such an action fails, it can be retried safely
(as opposed to, e.g., installing a new release each time we run it)
Other example:
kubectl -f some-file.yaml
k8s/helm-create-better-chart.md
Checking what we've done
- Let's see if DockerCoins is working!
Check the logs of the worker:
stern workerLook at the resources that were created:
kubectl get all
There are many issues to fix!
k8s/helm-create-better-chart.md
Can't pull image
- It looks like our images can't be found
- Use
kubectl describeon any of the pods in error
We're trying to pull
rng:1.16.0instead ofrng:v0.1!Where does that
1.16.0tag come from?
k8s/helm-create-better-chart.md
Inspecting our template
Let's look at the
templates/directory(and try to find the one generating the Deployment resource)
Show the structure of the
helmcoinschart that Helm generated:tree helmcoinsCheck the file
helmcoins/templates/deployment.yamlLook for the
image:parameter
The image tag references {{ .Chart.AppVersion }}. Where does that come from?
k8s/helm-create-better-chart.md
The .Chart variable
.Chartis a map corresponding to the values inChart.yamlLet's look for
AppVersionthere!
Check the file
helmcoins/Chart.yamlLook for the
appVersion:parameter
(Yes, the case is different between the template and the Chart file.)
k8s/helm-create-better-chart.md
Using the correct tags
If we change
AppVersiontov0.1, it will change for all deployments(including redis)
Instead, let's change the template to use
{{ .Values.image.tag }}(to match what we've specified in our values YAML files)
Edit
helmcoins/templates/deployment.yamlReplace
{{ .Chart.AppVersion }}with{{ .Values.image.tag }}
k8s/helm-create-better-chart.md
Upgrading to use the new template
Technically, we just made a new version of the chart
To use the new template, we need to upgrade the release to use that chart
Upgrade all components:
for COMPONENT in hasher redis rng webui worker; dohelm upgrade $COMPONENT helmcoinsdoneCheck how our pods are doing:
kubectl get pods
We should see all pods "Running". But ... not all of them are READY.
k8s/helm-create-better-chart.md
Troubleshooting readiness
hasher,rng,webuishould show up as1/1 READYBut
redisandworkershould show up as0/1 READYWhy?
k8s/helm-create-better-chart.md
Troubleshooting pods
The easiest way to troubleshoot pods is to look at events
We can look at all the events on the cluster (with
kubectl get events)Or we can use
kubectl describeon the objects that have problems(
kubectl describewill retrieve the events related to the object)
- Check the events for the redis pods:kubectl describe pod -l app.kubernetes.io/name=redis
It's failing both its liveness and readiness probes!
k8s/helm-create-better-chart.md
Healthchecks
The default chart defines healthchecks doing HTTP requests on port 80
That won't work for redis and worker
(redis is not HTTP, and not on port 80; worker doesn't even listen)
Healthchecks
The default chart defines healthchecks doing HTTP requests on port 80
That won't work for redis and worker
(redis is not HTTP, and not on port 80; worker doesn't even listen)
We could remove or comment out the healthchecks
We could also make them conditional
This sounds more interesting, let's do that!
k8s/helm-create-better-chart.md
Conditionals
We need to enclose the healthcheck block with:
{{ if false }}at the beginning (we can change the condition later){{ end }}at the end
Edit
helmcoins/templates/deployment.yamlAdd
{{ if false }}on the line beforelivenessProbeAdd
{{ end }}after thereadinessProbesection(see next slide for details)
k8s/helm-create-better-chart.md
This is what the new YAML should look like (added lines in yellow):
ports: - name: http containerPort: 80 protocol: TCP {{ if false }} livenessProbe: httpGet: path: / port: http readinessProbe: httpGet: path: / port: http {{ end }} resources: {{- toYaml .Values.resources | nindent 12 }}k8s/helm-create-better-chart.md
Testing the new chart
- We need to upgrade all the services again to use the new chart
Upgrade all components:
for COMPONENT in hasher redis rng webui worker; dohelm upgrade $COMPONENT helmcoinsdoneCheck how our pods are doing:
kubectl get pods
Everything should now be running!
k8s/helm-create-better-chart.md
What's next?
- Is this working now?
- Let's check the logs of the worker:stern worker
This error might look familiar ... The worker can't resolve redis.
Typically, that error means that the redis service doesn't exist.
k8s/helm-create-better-chart.md
Checking services
- What about the services created by our chart?
- Check the list of services:kubectl get services
They are named COMPONENT-helmcoins instead of just COMPONENT.
We need to change that!
k8s/helm-create-better-chart.md
Where do the service names come from?
Look at the YAML template used for the services
It should be using
{{ include "helmcoins.fullname" }}includeindicates a template block defined somewhere else
- Find where that
fullnamething is defined:grep define.*fullname helmcoins/templates/*
It should be in _helpers.tpl.
We can look at the definition, but it's fairly complex ...
k8s/helm-create-better-chart.md
Changing service names
Instead of that
{{ include }}tag, let's use the name of the releaseThe name of the release is available as
{{ .Release.Name }}
Edit
helmcoins/templates/service.yamlReplace the service name with
{{ .Release.Name }}Upgrade all the releases to use the new chart
Confirm that the services now have the right names
k8s/helm-create-better-chart.md
Is it working now?
If we look at the worker logs, it appears that the worker is still stuck
What could be happening?
Is it working now?
If we look at the worker logs, it appears that the worker is still stuck
What could be happening?
The redis service is not on port 80!
Let's see how the port number is set
We need to look at both the deployment template and the service template
k8s/helm-create-better-chart.md
Service template
In the service template, we have the following section:
ports:- port: {{ .Values.service.port }}targetPort: httpprotocol: TCPname: httpportis the port on which the service is "listening"(i.e. to which our code needs to connect)
targetPortis the port on which the pods are listeningThe
nameis not important (it's OK if it'shttpeven for non-HTTP traffic)
k8s/helm-create-better-chart.md
Setting the redis port
- Let's add a
service.portvalue to the redis release
Edit
redis.yamlto add:service:port: 6379Apply the new values file:
helm upgrade redis helmcoins --values=redis.yaml
k8s/helm-create-better-chart.md
Deployment template
If we look at the deployment template, we see this section:
ports:- name: httpcontainerPort: 80protocol: TCPThe container port is hard-coded to 80
We'll change it to use the port number specified in the values
k8s/helm-create-better-chart.md
Changing the deployment template
Edit
helmcoins/templates/deployment.yamlThe line with
containerPortshould be:containerPort: {{ .Values.service.port }}
k8s/helm-create-better-chart.md
Apply changes
Re-run the for loop to execute
helm upgradeone more timeCheck the worker logs
This time, it should be working!
k8s/helm-create-better-chart.md
Extra steps
We don't need to create a service for the worker
We can put the whole service block in a conditional
(this will require additional changes in other files referencing the service)
We can set the webui to be a NodePort service
We can change the number of workers with
replicaCountAnd much more!
:EN:- Writing better Helm charts for app components :FR:- Écriture de charts composant par composant
Charts using other charts
(automatically generated title slide)
Charts using other charts
Helm charts can have dependencies on other charts
These dependencies will help us to share or reuse components
(so that we write and maintain less manifests, less templates, less code!)
As an example, we will use a community chart for Redis
This will help people who write charts, and people who use them
... And potentially remove a lot of code! ✌️
Redis in DockerCoins
In the DockerCoins demo app, we have 5 components:
- 2 internal webservices
- 1 worker
- 1 public web UI
- 1 Redis data store
Every component is running some custom code, except Redis
Every component is using a custom image, except Redis
(which is using the official
redisimage)Could we use a standard chart for Redis?
Yes! Dependencies to the rescue!
Adding our dependency
First, we will add the dependency to the
Chart.yamlfileThen, we will ask Helm to download that dependency
We will also lock the dependency
(lock it to a specific version, to ensure reproducibility)
Declaring the dependency
- First, let's edit
Chart.yaml
- In
Chart.yaml, fill thedependenciessection:dependencies:- name: redisversion: 11.0.5repository: https://charts.bitnami.com/bitnamicondition: redis.enabled
Where do that repository and version come from?
We're assuming here that we did our reserach, or that our resident Helm expert advised us to use Bitnami's Redis chart.
Conditions
The
conditionfield gives us a way to enable/disable the dependency:conditions: redis.enabledHere, we can disable Redis with the Helm flag
--set redis.enabled=false(or set that value in a
values.yamlfile)Of course, this is mostly useful for optional dependencies
(otherwise, the app ends up being broken since it'll miss a component)
Lock & Load!
- After adding the dependency, we ask Helm to pin an download it
Ask Helm:
helm dependency update(Or
helm dep up)
- This wil create
Chart.lockand fetch the dependency
What's Chart.lock?
This is a common pattern with dependencies
(see also:
Gemfile.lock,package.json.lock, and many others)This lets us define loose dependencies in
Chart.yaml(e.g. "version 11.whatever, but below 12")
But have the exact version used in
Chart.lockThis ensures reproducible deployments
Chart.lockcan (should!) be added to our source treeChart.lockcan (should!) regularly be updated
Loose dependencies
Here is an example of loose version requirement:
dependencies:- name: redisversion: ">=11, <12"repository: https://charts.bitnami.com/bitnamiThis makes sure that we have the most recent version in the 11.x train
... But without upgrading to version 12.x
(because it might be incompatible)
build vs update
Helm actually offers two commands to manage dependencies:
helm dependency build= fetch dependencies listed inChart.lockhelm dependency update= updateChart.lock(and runbuild)When the dependency gets updated, we can/should:
helm dep up(updateChart.lockand fetch new chart)test!
if everything is fine,
git add Chart.lockand commit
Where are my dependencies?
Dependencies are downloaded to the
charts/subdirectoryWhen they're downloaded, they stay in compressed format (
.tgz)Should we commit them to our code repository?
Pros:
- more resilient to internet/mirror failures/decomissioning
Cons:
can add a lot of weight to the repo if charts are big or change often
this can be solved by extra tools like git-lfs
Dependency tuning
DockerCoins expects the
redisService to be namedredisOur Redis chart uses a different Service name by default
Service name is
{{ template "redis.fullname" . }}-masterredis.fullnamelooks like this:{{- define "redis.fullname" -}}{{- if .Values.fullnameOverride -}}{{- .Values.fullnameOverride | trunc 63 | trimSuffix "-" -}}{{- else -}}[...]{{- end }}{{- end }}How do we fix this?
Setting dependency variables
If we set
fullnameOverridetoredis:the
{{ template ... }}block will outputredisthe Service name will be
redis-master
A parent chart can set values for its dependencies
For example, in the parent's
values.yaml:redis: # Name of the dependencyfullnameOverride: redis # Value passed to rediscluster: # Other values passed to redisenabled: falseUser can also set variables with
--set=or with--values=
Passing templates
We can even pass template
{{ include "template.name" }}, but warning:need to be evaluated with the
tplfunction, on the child sideevaluated in the context of the child, with no access to parent variables
Getting rid of the -master
Even if we set that
fullnameOverride, the Service name will beredis-masterTo remove the
-mastersuffix, we need to edit the chart itselfTo edit the Redis chart, we need to embed it in our own chart
We need to:
decompress the chart
adjust
Chart.yamlaccordingly
Embedding a dependency
Decompress the chart:
cd chartstar zxf redis-*.tgzcd ..Edit
Chart.yamland update thedependenciessection:dependencies:- name: redisversion: '*' # No need to constraint version, from local filesRun
helm dep update
Updating the dependency
Now we can edit the Service name
(it should be in
charts/redis/templates/redis-master-svc.yaml)Then try to deploy the whole chart!
Embedding a dependency multiple times
What if we need multiple copies of the same subchart?
(for instance, if we need two completely different Redis servers)
We can declare a dependency multiple times, and specify an
alias:dependencies:- name: redisversion: '*'alias: querycache- name: redisversion: '*'alias: celeryqueue.Chart.Namewill be set to thealias
Compatibility with Helm 2
Chart
apiVersion: v1is the only version supported by Helm 2Chart v1 is also supported by Helm 3
Use v1 if you want to be compatible with Helm 2
Instead of
Chart.yaml, dependencies are defined inrequirements.yaml(and we should commit
requirements.lockinstead ofChart.lock)
:EN:- Depending on other charts :EN:- Charts within charts
:FR:- Dépendances entre charts :FR:- Un chart peut en cacher un autre
Helm and invalid values
(automatically generated title slide)
Helm and invalid values
A lot of Helm charts let us specify an image tag like this:
helm install ... --set image.tag=v1.0What happens if we make a small mistake, like this:
helm install ... --set imagetag=v1.0Or even, like this:
helm install ... --set image=v1.0
🤔
k8s/helm-values-schema-validation.md
Making mistakes
In the first case:
we set
imagetag=v1.0instead ofimage.tag=v1.0Helm will ignore that value (if it's not used anywhere in templates)
the chart is deployed with the default value instead
In the second case:
we set
image=v1.0instead ofimage.tag=v1.0imagewill be a string instead of an objectHelm will probably fail when trying to evaluate
image.tag
k8s/helm-values-schema-validation.md
Preventing mistakes
To prevent the first mistake, we need to tell Helm:
"let me know if any additional (unknonw) value was set!"
To prevent the second mistake, we need to tell Helm:
"
imageshould be an object, andimage.tagshould be a string!"We can do this with values schema validation
k8s/helm-values-schema-validation.md
Helm values schema validation
We can write a spec representing the possible values accepted by the chart
Helm will check the validity of the values before trying to install/upgrade
If it finds problems, it will stop immediately
The spec uses JSON Schema:
JSON Schema is a vocabulary that allows you to annotate and validate JSON documents.
JSON Schema is designed for JSON, but can easily work with YAML too
(or any language with
map|dict|associativearrayandlist|array|sequence|tuple)
k8s/helm-values-schema-validation.md
In practice
We need to put the JSON Schema spec in a file called
values.schema.json(at the root of our chart; right next to
values.yamletc.)The file is optional
We don't need to register or declare it in
Chart.yamlor anywhereLet's write a schema that will verify that ...
image.repositoryis an official image (string without slashes or dots)image.pullPolicycan only beAlways,Never,IfNotPresent
k8s/helm-values-schema-validation.md
values.schema.json
{ "$schema": "http://json-schema.org/schema#", "type": "object", "properties": { "image": { "type": "object", "properties": { "repository": { "type": "string", "pattern": "^[a-z0-9-_]+$" }, "pullPolicy": { "type": "string", "pattern": "^(Always|Never|IfNotPresent)$" } } } } }k8s/helm-values-schema-validation.md
Testing our schema
- Let's try to install a couple releases with that schema!
Try an invalid
pullPolicy:helm install broken --set image.pullPolicy=ShallNotPassTry an invalid value:
helm install should-break --set ImAgeTAg=toto
The first one fails, but the second one still passes ...
Why?
k8s/helm-values-schema-validation.md
Bailing out on unkown properties
We told Helm what properties (values) were valid
We didn't say what to do about additional (unknown) properties!
We can fix that with
"additionalProperties": false
- Edit
values.schema.jsonto add"additionalProperties": false{"$schema": "http://json-schema.org/schema#","type": "object","additionalProperties": false,"properties": {...
k8s/helm-values-schema-validation.md
Testing with unknown properties
Try to pass an extra property:
helm install should-break --set ImAgeTAg=totoTry to pass an extra nested property:
helm install does-it-work --set image.hello=world
The first command should break.
The second will not.
"additionalProperties": false needs to be specified at each level.
:EN:- Helm schema validation :FR:- Validation de schema Helm
Helm secrets
(automatically generated title slide)
Helm secrets
Helm can do rollbacks:
to previously installed charts
to previous sets of values
How and where does it store the data needed to do that?
Let's investigate!
Adding the repo
- If you haven't done it before, you need to add the repo for that chart
- Add the repo that holds the chart for the OWASP Juice Shop:helm repo add juice https://charts.securecodebox.io
We need a release
We need to install something with Helm
Let's use the
juice/juice-shopchart as an example
Install a release called
orangewith the chartjuice/juice-shop:helm upgrade orange juice/juice-shop --installLet's upgrade that release, and change a value:
helm upgrade orange juice/juice-shop --set ingress.enabled=true
Release history
- Helm stores successive revisions of each release
- View the history for that release:helm history orange
Where does that come from?
Investigate
Possible options:
local filesystem (no, because history is visible from other machines)
persistent volumes (no, Helm works even without them)
ConfigMaps, Secrets?
- Look for ConfigMaps and Secrets:kubectl get configmaps,secrets
Investigate
Possible options:
local filesystem (no, because history is visible from other machines)
persistent volumes (no, Helm works even without them)
ConfigMaps, Secrets?
- Look for ConfigMaps and Secrets:kubectl get configmaps,secrets
We should see a number of secrets with TYPE helm.sh/release.v1.
Unpacking a secret
- Let's find out what is in these Helm secrets
- Examine the secret corresponding to the second release of
orange:
(kubectl describe secret sh.helm.release.v1.orange.v2v1is the secret format;v2means revision 2 of theorangerelease)
There is a key named release.
Unpacking the release data
- Let's see what's in this
releasething!
- Dump the secret:kubectl get secret sh.helm.release.v1.orange.v2 \-o go-template='{{ .data.release }}'
Secrets are encoded in base64. We need to decode that!
Decoding base64
- We can pipe the output through
base64 -dor use go-template'sbase64decode
- Decode the secret:kubectl get secret sh.helm.release.v1.orange.v2 \-o go-template='{{ .data.release | base64decode }}'
Decoding base64
- We can pipe the output through
base64 -dor use go-template'sbase64decode
- Decode the secret:kubectl get secret sh.helm.release.v1.orange.v2 \-o go-template='{{ .data.release | base64decode }}'
... Wait, this still looks like base64. What's going on?
Decoding base64
- We can pipe the output through
base64 -dor use go-template'sbase64decode
- Decode the secret:kubectl get secret sh.helm.release.v1.orange.v2 \-o go-template='{{ .data.release | base64decode }}'
... Wait, this still looks like base64. What's going on?
Let's try one more round of decoding!
Decoding harder
- Just add one more base64 decode filter
- Decode it twice:kubectl get secret sh.helm.release.v1.orange.v2 \-o go-template='{{ .data.release | base64decode | base64decode }}'
Decoding harder
- Just add one more base64 decode filter
- Decode it twice:kubectl get secret sh.helm.release.v1.orange.v2 \-o go-template='{{ .data.release | base64decode | base64decode }}'
... OK, that was a lot of binary data. What sould we do with it?
Guessing data type
- We could use
fileto figure out the data type
- Pipe the decoded release through
file -:kubectl get secret sh.helm.release.v1.orange.v2 \-o go-template='{{ .data.release | base64decode | base64decode }}' \| file -
Guessing data type
- We could use
fileto figure out the data type
- Pipe the decoded release through
file -:kubectl get secret sh.helm.release.v1.orange.v2 \-o go-template='{{ .data.release | base64decode | base64decode }}' \| file -
Gzipped data! It can be decoded with gunzip -c.
Uncompressing the data
- Let's uncompress the data and save it to a file
Rerun the previous command, but with
| gunzip -c > release-info:kubectl get secret sh.helm.release.v1.orange.v2 \-o go-template='{{ .data.release | base64decode | base64decode }}' \| gunzip -c > release-infoLook at
release-info:cat release-info
It's a bundle of YAML JSON.
Looking at the JSON
If we inspect that JSON (e.g. with jq keys release-info), we see:
chart(contains the entire chart used for that release)config(contains the values that we've set)info(date of deployment, status messages)manifest(YAML generated from the templates)name(name of the release, soorange)namespace(namespace where we deployed the release)version(revision number within that release; starts at 1)
The chart is in a structured format, but it's entirely captured in this JSON.
Conclusions
Helm stores each release information in a Secret in the namespace of the release
The secret is JSON object (gzipped and encoded in base64)
It contains the manifests generated for that release
... And everything needed to rebuild these manifests
(including the full source of the chart, and the values used)
This allows arbitrary rollbacks, as well as tweaking values even without having access to the source of the chart (or the chart repo) used for deployment
:EN:- Deep dive into Helm internals :FR:- Fonctionnement interne de Helm
CI/CD with GitLab
(automatically generated title slide)
CI/CD with GitLab
In this section, we will see how to set up a CI/CD pipeline with GitLab
(using a "self-hosted" GitLab; i.e. running on our Kubernetes cluster)
The big picture:
each time we push code to GitLab, it will be deployed in a staging environment
each time we push the
productiontag, it will be deployed in production
Disclaimers
We'll use GitLab here as an exemple, but there are many other options
(e.g. some combination of Argo, Harbor, Tekton ...)
There are also hosted options
(e.g. GitHub Actions and many others)
We'll use a specific pipeline and workflow, but it's purely arbitrary
(treat it as a source of inspiration, not a model to be copied!)
Workflow overview
Push code to GitLab's git server
GitLab notices the
.gitlab-ci.ymlfile, which defines our pipelineOur pipeline can have multiple stages executed sequentially
(e.g. lint, build, test, deploy ...)
Each stage can have multiple jobs executed in parallel
(e.g. build images in parallel)
Each job will be executed in an independent runner pod
Pipeline overview
Our repository holds source code, Dockerfiles, and a Helm chart
Lint stage will check the Helm chart validity
Build stage will build container images
(and push them to GitLab's integrated registry)
Deploy stage will deploy the Helm chart, using these images
Pushes to
productionwill deploy to "the" production namespacePushes to other tags/branches will deploy to a namespace created on the fly
We will discuss shortcomings and alternatives and the end of this chapter!
Lots of requirements
We need a lot of components to pull this off:
a domain name
a storage class
a TLS-capable ingress controller
the cert-manager operator
GitLab itself
the GitLab pipeline
Wow, why?!?
I find your lack of TLS disturbing
We need a container registry (obviously!)
Docker (and other container engines) require TLS on the registry
(with valid certificates)
A few options:
use a "real" TLS certificate (e.g. obtained with Let's Encrypt)
use a self-signed TLS certificate
communicate with the registry over localhost (TLS isn't required then)
Why not self-signed certs?
When using self-signed certs, we need to either:
add the cert (or CA) to trusted certs
disable cert validation
This needs to be done on every client connecting to the registry:
CI/CD pipeline (building and pushing images)
container engine (deploying the images)
other tools (e.g. container security scanner)
It's doable, but it's a lot of hacks (especially when adding more tools!)
Why not localhost?
TLS is usually not required when the registry is on localhost
We could expose the registry e.g. on a
NodePort... And then tweak the CI/CD pipeline to use that instead
This is great when obtaining valid certs is difficult:
air-gapped or internal environments (that can't use Let's Encrypt)
no domain name available
Downside: the registry isn't easily or safely available from outside
(the
NodePortessentially defeats TLS)
Can we use nip.io?
We will use Let's Encrypt
Let's Encrypt has a quota of certificates per domain
(in 2020, that was 50 certificates per week per domain)
So if we all use
nip.io, we will probably run into that limitBut you can try and see if it works!
Ingress
We will assume that we have a domain name pointing to our cluster
(i.e. with a wildcard record pointing to at least one node of the cluster)
We will get traffic in the cluster by leveraging
ExternalIPsservices(but it would be easy to use
LoadBalancerservices instead)We will use Traefik as the ingress controller
(but any other one should work too)
We will use cert-manager to obtain certificates with Let's Encrypt
Other details
We will deploy GitLab with its official Helm chart
It will still require a bunch of parameters and customization
We also need a Storage Class
(unless our cluster already has one, of course)
We suggest the Rancher local path provisioner
Setting everything up
git clone https://github.com/jpetazzo/kubecoinexport EMAIL=xxx@example.com DOMAIN=awesome-kube-ci.io(we need a real email address and a domain pointing to the cluster!)
. setup-gitlab-on-k8s.rc(this doesn't do anything, but defines a number of helper functions)
Execute each helper function, one after another
(try
do_[TAB]to see these functions)
Local Storage
do_1_localstorage
Applies the YAML directly from Rancher's repository.
Annotate the Storage Class so that it becomes the default one.
Traefik
do_2_traefik_with_externalips
Install the official Traefik Helm chart.
Instead of a LoadBalancer service, use a ClusterIP with ExternalIPs.
Automatically infer the ExternalIPs from kubectl get nodes.
Enable TLS.
cert-manager
do_3_certmanager
Install cert-manager using their official YAML.
Easy-peasy.
Certificate issuers
do_4_issuers
Create a couple of ClusterIssuer resources for cert-manager.
(One for the staging Let's Encrypt environment, one for production.)
Note: this requires to specify a valid $EMAIL address!
Note: if this fails, wait a bit and try again (cert-manager needs to be up).
GitLab
do_5_gitlab
Deploy GitLab using their official Helm chart.
We pass a lot of parameters to this chart:
- the domain name to use
- disable GitLab's own ingress and cert-manager
- annotate the ingress resources so that cert-manager kicks in
- bind the shell service (git over SSH) to port 222 to avoid conflict
- use ExternalIPs for that shell service
Note: on modest cloud instances, it can take 10 minutes for GitLab to come up.
We can check the status with kubectl get pods --namespace=gitlab
Log into GitLab and configure it
do_6_showlogin
This will get the GitLab root password (stored in a Secret).
Then we need to:
- log into GitLab
- add our SSH key (top-right user menu → settings, then SSH keys on the left)
- create a project (using the + menu next to the search bar on top)
- go to project configuration (on the left, settings → CI/CD)
- add a
KUBECONFIGfile variable with the content of our.kube/configfile - go to settings → access tokens to create a read-only registry token
- add variables
REGISTRY_USERandREGISTRY_PASSWORDwith that token - push our repo (
git remote add gitlab ...thengit push gitlab ...)
Monitoring progress and troubleshooting
Click on "CI/CD" in the left bar to view pipelines
If you see a permission issue mentioning
system:serviceaccount:gitlab:...:make sure you did set
KUBECONFIGcorrectly!GitLab will create namespaces named
gl-<user>-<project>At the end of the deployment, the web UI will be available on some unique URL
(
http://<user>-<project>-<githash>-gitlab.<domain>)
Production
git tag -f production && git push -f --tagsOur CI/CD pipeline will deploy on the production URL
(
http://<user>-<project>-gitlab.<domain>)It will do it only if that same git commit was pushed to staging first
(look in the pipeline configuration file to see how it's done!)
Let's talk about build
There are many ways to build container images on Kubernetes
And they all suckMany of them have inconveniencing issuesLet's do a quick review!
Docker-based approaches
Bind-mount the Docker socket
- very easy, but requires Docker Engine
- build resource usage "evades" Kubernetes scheduler
- insecure
Docker-in-Docker in a pod
- requires privileged pod
- insecure
- approaches like rootless or sysbox might help in the future
External build host
- more secure
- requires resources outside of the Kubernetes cluster
Non-privileged builders
Kaniko
- each build runs in its own containers or pod
- no caching by default
- registry-based caching is possible
BuildKit /
docker buildx- can leverage Docker Engine or long-running Kubernetes worker pod
- supports distributed, multi-arch build farms
- basic caching out of the box
- can also leverage registry-based caching
Discussion
Our CI/CD workflow is just one of the many possibilities
It would be nice to add some actual unit or e2e tests
Map the production namespace to a "real" domain name
Automatically remove older staging environments
(see e.g. kube-janitor)
Deploy production to a separate cluster
Better segregate permissions
(don't give
cluster-adminto the GitLab pipeline)
Pros
GitLab is an amazing, open source, all-in-one platform
Available as hosted, community, or enterprise editions
Rich ecosystem, very customizable
Can run on Kubernetes, or somewhere else
Cons
It can be difficult to use components separately
(e.g. use a different registry, or a different job runner)
More than one way to configure it
(it's not an opinionated platform)
Not "Kubernetes-native"
(for instance, jobs are not Kubernetes jobs)
Job latency could be improved
Note: most of these drawbacks are the flip side of the "pros" on the previous slide!
:EN:- CI/CD with GitLab :FR:- CI/CD avec GitLab
Network policies
(automatically generated title slide)
Network policies
Namespaces help us to organize resources
Namespaces do not provide isolation
By default, every pod can contact every other pod
By default, every service accepts traffic from anyone
If we want this to be different, we need network policies
What's a network policy?
A network policy is defined by the following things.
A pod selector indicating which pods it applies to
e.g.: "all pods in namespace
bluewith the labelzone=internal"A list of ingress rules indicating which inbound traffic is allowed
e.g.: "TCP connections to ports 8000 and 8080 coming from pods with label
zone=dmz, and from the external subnet 4.42.6.0/24, except 4.42.6.5"A list of egress rules indicating which outbound traffic is allowed
A network policy can provide ingress rules, egress rules, or both.
How do network policies apply?
A pod can be "selected" by any number of network policies
If a pod isn't selected by any network policy, then its traffic is unrestricted
(In other words: in the absence of network policies, all traffic is allowed)
If a pod is selected by at least one network policy, then all traffic is blocked ...
... unless it is explicitly allowed by one of these network policies
Traffic filtering is flow-oriented
Network policies deal with connections, not individual packets
Example: to allow HTTP (80/tcp) connections to pod A, you only need an ingress rule
(You do not need a matching egress rule to allow response traffic to go through)
This also applies for UDP traffic
(Allowing DNS traffic can be done with a single rule)
Network policy implementations use stateful connection tracking
Pod-to-pod traffic
Connections from pod A to pod B have to be allowed by both pods:
pod A has to be unrestricted, or allow the connection as an egress rule
pod B has to be unrestricted, or allow the connection as an ingress rule
As a consequence: if a network policy restricts traffic going from/to a pod,
the restriction cannot be overridden by a network policy selecting another podThis prevents an entity managing network policies in namespace A (but without permission to do so in namespace B) from adding network policies giving them access to namespace B
The rationale for network policies
In network security, it is generally considered better to "deny all, then allow selectively"
(The other approach, "allow all, then block selectively" makes it too easy to leave holes)
As soon as one network policy selects a pod, the pod enters this "deny all" logic
Further network policies can open additional access
Good network policies should be scoped as precisely as possible
In particular: make sure that the selector is not too broad
(Otherwise, you end up affecting pods that were otherwise well secured)
Our first network policy
This is our game plan:
run a web server in a pod
create a network policy to block all access to the web server
create another network policy to allow access only from specific pods
Running our test web server
- Let's use the
nginximage:kubectl create deployment testweb --image=nginx
Find out the IP address of the pod with one of these two commands:
kubectl get pods -o wide -l app=testwebIP=$(kubectl get pods -l app=testweb -o json | jq -r .items[0].status.podIP)Check that we can connect to the server:
curl $IP
The curl command should show us the "Welcome to nginx!" page.
Adding a very restrictive network policy
The policy will select pods with the label
app=testwebIt will specify an empty list of ingress rules (matching nothing)
Apply the policy in this YAML file:
kubectl apply -f ~/container.training/k8s/netpol-deny-all-for-testweb.yamlCheck if we can still access the server:
curl $IP
The curl command should now time out.
Looking at the network policy
This is the file that we applied:
kind: NetworkPolicyapiVersion: networking.k8s.io/v1metadata: name: deny-all-for-testwebspec: podSelector: matchLabels: app: testweb ingress: []Allowing connections only from specific pods
We want to allow traffic from pods with the label
run=testcurlReminder: this label is automatically applied when we do
kubectl run testcurl ...
- Apply another policy:kubectl apply -f ~/container.training/k8s/netpol-allow-testcurl-for-testweb.yaml
Looking at the network policy
This is the second file that we applied:
kind: NetworkPolicyapiVersion: networking.k8s.io/v1metadata: name: allow-testcurl-for-testwebspec: podSelector: matchLabels: app: testweb ingress: - from: - podSelector: matchLabels: run: testcurlTesting the network policy
- Let's create pods with, and without, the required label
Try to connect to testweb from a pod with the
run=testcurllabel:kubectl run testcurl --rm -i --image=centos -- curl -m3 $IPTry to connect to testweb with a different label:
kubectl run testkurl --rm -i --image=centos -- curl -m3 $IP
The first command will work (and show the "Welcome to nginx!" page).
The second command will fail and time out after 3 seconds.
(The timeout is obtained with the -m3 option.)
An important warning
Some network plugins only have partial support for network policies
For instance, Weave added support for egress rules in version 2.4 (released in July 2018)
But only recently added support for ipBlock in version 2.5 (released in Nov 2018)
Unsupported features might be silently ignored
(Making you believe that you are secure, when you're not)
Network policies, pods, and services
Network policies apply to pods
A service can select multiple pods
(And load balance traffic across them)
It is possible that we can connect to some pods, but not some others
(Because of how network policies have been defined for these pods)
In that case, connections to the service will randomly pass or fail
(Depending on whether the connection was sent to a pod that we have access to or not)
Network policies and namespaces
A good strategy is to isolate a namespace, so that:
all the pods in the namespace can communicate together
other namespaces cannot access the pods
external access has to be enabled explicitly
Let's see what this would look like for the DockerCoins app!
Network policies for DockerCoins
We are going to apply two policies
The first policy will prevent traffic from other namespaces
The second policy will allow traffic to the
webuipodsThat's all we need for that app!
Blocking traffic from other namespaces
This policy selects all pods in the current namespace.
It allows traffic only from pods in the current namespace.
(An empty podSelector means "all pods.")
kind: NetworkPolicyapiVersion: networking.k8s.io/v1metadata: name: deny-from-other-namespacesspec: podSelector: {} ingress: - from: - podSelector: {}Allowing traffic to webui pods
This policy selects all pods with label app=webui.
It allows traffic from any source.
(An empty from field means "all sources.")
kind: NetworkPolicyapiVersion: networking.k8s.io/v1metadata: name: allow-webuispec: podSelector: matchLabels: app: webui ingress: - from: []Applying both network policies
- Both network policies are declared in the file
k8s/netpol-dockercoins.yaml
Apply the network policies:
kubectl apply -f ~/container.training/k8s/netpol-dockercoins.yamlCheck that we can still access the web UI from outside
(and that the app is still working correctly!)Check that we can't connect anymore to
rngorhasherthrough their ClusterIP
Note: using kubectl proxy or kubectl port-forward allows us to connect
regardless of existing network policies. This allows us to debug and
troubleshoot easily, without having to poke holes in our firewall.
Cleaning up our network policies
The network policies that we have installed block all traffic to the default namespace
We should remove them, otherwise further exercises will fail!
- Remove all network policies:kubectl delete networkpolicies --all
Protecting the control plane
Should we add network policies to block unauthorized access to the control plane?
(etcd, API server, etc.)
Protecting the control plane
Should we add network policies to block unauthorized access to the control plane?
(etcd, API server, etc.)
At first, it seems like a good idea ...
Protecting the control plane
Should we add network policies to block unauthorized access to the control plane?
(etcd, API server, etc.)
At first, it seems like a good idea ...
But it shouldn't be necessary:
not all network plugins support network policies
the control plane is secured by other methods (mutual TLS, mostly)
the code running in our pods can reasonably expect to contact the API
(and it can do so safely thanks to the API permission model)
If we block access to the control plane, we might disrupt legitimate code
...Without necessarily improving security
Tools and resources
Two resources by Ahmet Alp Balkan:
a very good talk about network policies at KubeCon North America 2017
a repository of ready-to-use recipes for network policies
Documentation
As always, the Kubernetes documentation is a good starting point
The API documentation has a lot of detail about the format of various objects:
:EN:- Isolating workloads with Network Policies :FR:- Isolation réseau avec les network policies
Authentication and authorization
(automatically generated title slide)
Authentication and authorization
In this section, we will:
define authentication and authorization
explain how they are implemented in Kubernetes
talk about tokens, certificates, service accounts, RBAC ...
But first: why do we need all this?
The need for fine-grained security
The Kubernetes API should only be available for identified users
we don't want "guest access" (except in very rare scenarios)
we don't want strangers to use our compute resources, delete our apps ...
our keys and passwords should not be exposed to the public
Users will often have different access rights
cluster admin (similar to UNIX "root") can do everything
developer might access specific resources, or a specific namespace
supervision might have read only access to most resources
Example: custom HTTP load balancer
Let's imagine that we have a custom HTTP load balancer for multiple apps
Each app has its own Deployment resource
By default, the apps are "sleeping" and scaled to zero
When a request comes in, the corresponding app gets woken up
After some inactivity, the app is scaled down again
This HTTP load balancer needs API access (to scale up/down)
What if a wild vulnerability appears?
Consequences of vulnerability
If the HTTP load balancer has the same API access as we do:
full cluster compromise (easy data leak, cryptojacking...)
If the HTTP load balancer has
updatepermissions on the Deployments:defacement (easy), MITM / impersonation (medium to hard)
If the HTTP load balancer only has permission to
scalethe Deployments:denial-of-service
All these outcomes are bad, but some are worse than others
Definitions
Authentication = verifying the identity of a person
On a UNIX system, we can authenticate with login+password, SSH keys ...
Authorization = listing what they are allowed to do
On a UNIX system, this can include file permissions, sudoer entries ...
Sometimes abbreviated as "authn" and "authz"
In good modular systems, these things are decoupled
(so we can e.g. change a password or SSH key without having to reset access rights)
Authentication in Kubernetes
When the API server receives a request, it tries to authenticate it
(it examines headers, certificates... anything available)
Many authentication methods are available and can be used simultaneously
(we will see them on the next slide)
It's the job of the authentication method to produce:
- the user name
- the user ID
- a list of groups
The API server doesn't interpret these; that'll be the job of authorizers
Authentication methods
TLS client certificates
(that's what we've been doing with
kubectlso far)Bearer tokens
(a secret token in the HTTP headers of the request)
-
(carrying user and password in an HTTP header; deprecated since Kubernetes 1.19)
Authentication proxy
(sitting in front of the API and setting trusted headers)
Anonymous requests
If any authentication method rejects a request, it's denied
(
401 UnauthorizedHTTP code)If a request is neither rejected nor accepted by anyone, it's anonymous
the user name is
system:anonymousthe list of groups is
[system:unauthenticated]
By default, the anonymous user can't do anything
(that's what you get if you just
curlthe Kubernetes API)
Authentication with TLS certificates
This is enabled in most Kubernetes deployments
The user name is derived from the
CNin the client certificatesThe groups are derived from the
Ofields in the client certificateFrom the point of view of the Kubernetes API, users do not exist
(i.e. they are not stored in etcd or anywhere else)
Users can be created (and added to groups) independently of the API
The Kubernetes API can be set up to use your custom CA to validate client certs
Viewing our admin certificate
- Let's inspect the certificate we've been using all this time!
- This command will show the
CNandOfields for our certificate:kubectl config view \--raw \-o json \| jq -r .users[0].user[\"client-certificate-data\"] \| openssl base64 -d -A \| openssl x509 -text \| grep Subject:
Let's break down that command together! 😅
Breaking down the command
kubectl config viewshows the Kubernetes user configuration--rawincludes certificate information (which shows as REDACTED otherwise)-o jsonoutputs the information in JSON format| jq ...extracts the field with the user certificate (in base64)| openssl base64 -d -Adecodes the base64 format (now we have a PEM file)| openssl x509 -textparses the certificate and outputs it as plain text| grep Subject:shows us the line that interests us
→ We are user kubernetes-admin, in group system:masters.
(We will see later how and why this gives us the permissions that we have.)
User certificates in practice
The Kubernetes API server does not support certificate revocation
(see issue #18982)
As a result, we don't have an easy way to terminate someone's access
(if their key is compromised, or they leave the organization)
Option 1: re-create a new CA and re-issue everyone's certificates
→ Maybe OK if we only have a few users; no way otherwiseOption 2: don't use groups; grant permissions to individual users
→ Inconvenient if we have many users and teams; error-proneOption 3: issue short-lived certificates (e.g. 24 hours) and renew them often
→ This can be facilitated by e.g. Vault or by the Kubernetes CSR API
Authentication with tokens
Tokens are passed as HTTP headers:
Authorization: Bearer and-then-here-comes-the-tokenTokens can be validated through a number of different methods:
static tokens hard-coded in a file on the API server
bootstrap tokens (special case to create a cluster or join nodes)
OpenID Connect tokens (to delegate authentication to compatible OAuth2 providers)
service accounts (these deserve more details, coming right up!)
Service accounts
A service account is a user that exists in the Kubernetes API
(it is visible with e.g.
kubectl get serviceaccounts)Service accounts can therefore be created / updated dynamically
(they don't require hand-editing a file and restarting the API server)
A service account is associated with a set of secrets
(the kind that you can view with
kubectl get secrets)Service accounts are generally used to grant permissions to applications, services...
(as opposed to humans)
Token authentication in practice
We are going to list existing service accounts
Then we will extract the token for a given service account
And we will use that token to authenticate with the API
Listing service accounts
- The resource name is
serviceaccountorsafor short:kubectl get sa
There should be just one service account in the default namespace: default.
Finding the secret
- List the secrets for the
defaultservice account:kubectl get sa default -o yamlSECRET=$(kubectl get sa default -o json | jq -r .secrets[0].name)
It should be named default-token-XXXXX.
Extracting the token
- The token is stored in the secret, wrapped with base64 encoding
View the secret:
kubectl get secret $SECRET -o yamlExtract the token and decode it:
TOKEN=$(kubectl get secret $SECRET -o json \| jq -r .data.token | openssl base64 -d -A)
Using the token
- Let's send a request to the API, without and with the token
Find the ClusterIP for the
kubernetesservice:kubectl get svc kubernetesAPI=$(kubectl get svc kubernetes -o json | jq -r .spec.clusterIP)Connect without the token:
curl -k https://$APIConnect with the token:
curl -k -H "Authorization: Bearer $TOKEN" https://$API
Results
In both cases, we will get a "Forbidden" error
Without authentication, the user is
system:anonymousWith authentication, it is shown as
system:serviceaccount:default:defaultThe API "sees" us as a different user
But neither user has any rights, so we can't do nothin'
Let's change that!
Authorization in Kubernetes
There are multiple ways to grant permissions in Kubernetes, called authorizers:
Node Authorization (used internally by kubelet; we can ignore it)
Attribute-based access control (powerful but complex and static; ignore it too)
Webhook (each API request is submitted to an external service for approval)
Role-based access control (associates permissions to users dynamically)
The one we want is the last one, generally abbreviated as RBAC
Role-based access control
RBAC allows to specify fine-grained permissions
Permissions are expressed as rules
A rule is a combination of:
verbs like create, get, list, update, delete...
resources (as in "API resource," like pods, nodes, services...)
resource names (to specify e.g. one specific pod instead of all pods)
in some case, subresources (e.g. logs are subresources of pods)
From rules to roles to rolebindings
A role is an API object containing a list of rules
Example: role "external-load-balancer-configurator" can:
- [list, get] resources [endpoints, services, pods]
- [update] resources [services]
A rolebinding associates a role with a user
Example: rolebinding "external-load-balancer-configurator":
- associates user "external-load-balancer-configurator"
- with role "external-load-balancer-configurator"
Yes, there can be users, roles, and rolebindings with the same name
It's a good idea for 1-1-1 bindings; not so much for 1-N ones
Cluster-scope permissions
API resources Role and RoleBinding are for objects within a namespace
We can also define API resources ClusterRole and ClusterRoleBinding
These are a superset, allowing us to:
specify actions on cluster-wide objects (like nodes)
operate across all namespaces
We can create Role and RoleBinding resources within a namespace
ClusterRole and ClusterRoleBinding resources are global
Pods and service accounts
A pod can be associated with a service account
by default, it is associated with the
defaultservice accountas we saw earlier, this service account has no permissions anyway
The associated token is exposed to the pod's filesystem
(in
/var/run/secrets/kubernetes.io/serviceaccount/token)Standard Kubernetes tooling (like
kubectl) will look for it thereSo Kubernetes tools running in a pod will automatically use the service account
In practice
We are going to create a service account
We will use a default cluster role (
view)We will bind together this role and this service account
Then we will run a pod using that service account
In this pod, we will install
kubectland check our permissions
Creating a service account
We will call the new service account
viewer(note that nothing prevents us from calling it
view, like the role)
Create the new service account:
kubectl create serviceaccount viewerList service accounts now:
kubectl get serviceaccounts
Binding a role to the service account
Binding a role = creating a rolebinding object
We will call that object
viewercanview(but again, we could call it
view)
- Create the new role binding:kubectl create rolebinding viewercanview \--clusterrole=view \--serviceaccount=default:viewer
It's important to note a couple of details in these flags...
Roles vs Cluster Roles
We used
--clusterrole=viewWhat would have happened if we had used
--role=view?we would have bound the role
viewfrom the local namespace
(instead of the cluster roleview)the command would have worked fine (no error)
but later, our API requests would have been denied
This is a deliberate design decision
(we can reference roles that don't exist, and create/update them later)
Users vs Service Accounts
We used
--serviceaccount=default:viewerWhat would have happened if we had used
--user=default:viewer?we would have bound the role to a user instead of a service account
again, the command would have worked fine (no error)
...but our API requests would have been denied later
What's about the
default:prefix?that's the namespace of the service account
yes, it could be inferred from context, but...
kubectlrequires it
Testing
- We will run an
alpinepod and installkubectlthere
Run a one-time pod:
kubectl run eyepod --rm -ti --restart=Never \--serviceaccount=viewer \--image alpineInstall
curl, then use it to installkubectl:apk add --no-cache curlURLBASE=https://storage.googleapis.com/kubernetes-release/releaseKUBEVER=$(curl -s $URLBASE/stable.txt)curl -LO $URLBASE/$KUBEVER/bin/linux/amd64/kubectlchmod +x kubectl
Running kubectl in the pod
- We'll try to use our
viewpermissions, then to create an object
Check that we can, indeed, view things:
./kubectl get allBut that we can't create things:
./kubectl create deployment testrbac --image=nginxExit the container with
exitor^D
Testing directly with kubectl
We can also check for permission with
kubectl auth can-i:kubectl auth can-i list nodeskubectl auth can-i create podskubectl auth can-i get pod/name-of-podkubectl auth can-i get /url-fragment-of-api-request/kubectl auth can-i '*' servicesAnd we can check permissions on behalf of other users:
kubectl auth can-i list nodes \--as some-userkubectl auth can-i list nodes \--as system:serviceaccount:<namespace>:<name-of-service-account>
Where does this view role come from?
Kubernetes defines a number of ClusterRoles intended to be bound to users
cluster-admincan do everything (thinkrooton UNIX)admincan do almost everything (except e.g. changing resource quotas and limits)editis similar toadmin, but cannot view or edit permissionsviewhas read-only access to most resources, except permissions and secrets
In many situations, these roles will be all you need.
You can also customize them!
Customizing the default roles
If you need to add permissions to these default roles (or others),
you can do it through the ClusterRole Aggregation mechanismThis happens by creating a ClusterRole with the following labels:
metadata:labels:rbac.authorization.k8s.io/aggregate-to-admin: "true"rbac.authorization.k8s.io/aggregate-to-edit: "true"rbac.authorization.k8s.io/aggregate-to-view: "true"This ClusterRole permissions will be added to
admin/edit/viewrespectivelyThis is particulary useful when using CustomResourceDefinitions
(since Kubernetes cannot guess which resources are sensitive and which ones aren't)
Where do our permissions come from?
When interacting with the Kubernetes API, we are using a client certificate
We saw previously that this client certificate contained:
CN=kubernetes-adminandO=system:mastersLet's look for these in existing ClusterRoleBindings:
kubectl get clusterrolebindings -o yaml |grep -e kubernetes-admin -e system:masters(
system:mastersshould show up, but notkubernetes-admin.)Where does this match come from?
The system:masters group
If we eyeball the output of
kubectl get clusterrolebindings -o yaml, we'll find out!It is in the
cluster-adminbinding:kubectl describe clusterrolebinding cluster-adminThis binding associates
system:masterswith the cluster rolecluster-adminAnd the
cluster-adminis, basically,root:kubectl describe clusterrole cluster-admin
Figuring out who can do what
For auditing purposes, sometimes we want to know who can perform which actions
There are a few tools to help us with that, available as
kubectlplugins:kubectl who-can/ kubectl-who-can by Aqua Securitykubectl access-matrix/ Rakkess (Review Access) by Cornelius Weigkubectl rbac-lookup/ RBAC Lookup by FairwindsOps
kubectlplugins can be installed and managed withkrewThey can also be installed and executed as standalone programs
:EN:- Authentication and authorization in Kubernetes :EN:- Authentication with tokens and certificates :EN:- Authorization with RBAC (Role-Based Access Control) :EN:- Restricting permissions with Service Accounts :EN:- Working with Roles, Cluster Roles, Role Bindings, etc.
:FR:- Identification et droits d'accès dans Kubernetes :FR:- Mécanismes d'identification par jetons et certificats :FR:- Le modèle RBAC (Role-Based Access Control) :FR:- Restreindre les permissions grâce aux Service Accounts :FR:- Comprendre les Roles, Cluster Roles, Role Bindings, etc.
Pod Security Policies
(automatically generated title slide)
Pod Security Policies
By default, our pods and containers can do everything
(including taking over the entire cluster)
We are going to show an example of a malicious pod
Then we will explain how to avoid this with PodSecurityPolicies
We will enable PodSecurityPolicies on our cluster
We will create a couple of policies (restricted and permissive)
Finally we will see how to use them to improve security on our cluster
Setting up a namespace
For simplicity, let's work in a separate namespace
Let's create a new namespace called "green"
Create the "green" namespace:
kubectl create namespace greenChange to that namespace:
kns green
Creating a basic Deployment
- Just to check that everything works correctly, deploy NGINX
Create a Deployment using the official NGINX image:
kubectl create deployment web --image=nginxConfirm that the Deployment, ReplicaSet, and Pod exist, and that the Pod is running:
kubectl get all
One example of malicious pods
We will now show an escalation technique in action
We will deploy a DaemonSet that adds our SSH key to the root account
(on each node of the cluster)
The Pods of the DaemonSet will do so by mounting
/rootfrom the host
Check the file
k8s/hacktheplanet.yamlwith a text editor:vim ~/container.training/k8s/hacktheplanet.yamlIf you would like, change the SSH key (by changing the GitHub user name)
Deploying the malicious pods
- Let's deploy our "exploit"!
Create the DaemonSet:
kubectl create -f ~/container.training/k8s/hacktheplanet.yamlCheck that the pods are running:
kubectl get podsConfirm that the SSH key was added to the node's root account:
sudo cat /root/.ssh/authorized_keys
Cleaning up
- Before setting up our PodSecurityPolicies, clean up that namespace
Remove the DaemonSet:
kubectl delete daemonset hacktheplanetRemove the Deployment:
kubectl delete deployment web
Pod Security Policies in theory
To use PSPs, we need to activate their specific admission controller
That admission controller will intercept each pod creation attempt
It will look at:
who/what is creating the pod
which PodSecurityPolicies they can use
which PodSecurityPolicies can be used by the Pod's ServiceAccount
Then it will compare the Pod with each PodSecurityPolicy one by one
If a PodSecurityPolicy accepts all the parameters of the Pod, it is created
Otherwise, the Pod creation is denied and it won't even show up in
kubectl get pods
Pod Security Policies fine print
With RBAC, using a PSP corresponds to the verb
useon the PSP(that makes sense, right?)
If no PSP is defined, no Pod can be created
(even by cluster admins)
Pods that are already running are not affected
If we create a Pod directly, it can use a PSP to which we have access
If the Pod is created by e.g. a ReplicaSet or DaemonSet, it's different:
the ReplicaSet / DaemonSet controllers don't have access to our policies
therefore, we need to give access to the PSP to the Pod's ServiceAccount
Pod Security Policies in practice
We are going to enable the PodSecurityPolicy admission controller
At that point, we won't be able to create any more pods (!)
Then we will create a couple of PodSecurityPolicies
...And associated ClusterRoles (giving
useaccess to the policies)Then we will create RoleBindings to grant these roles to ServiceAccounts
We will verify that we can't run our "exploit" anymore
Enabling Pod Security Policies
To enable Pod Security Policies, we need to enable their admission plugin
This is done by adding a flag to the API server
On clusters deployed with
kubeadm, the control plane runs in static podsThese pods are defined in YAML files located in
/etc/kubernetes/manifestsKubelet watches this directory
Each time a file is added/removed there, kubelet creates/deletes the corresponding pod
Updating a file causes the pod to be deleted and recreated
Updating the API server flags
- Let's edit the manifest for the API server pod
Have a look at the static pods:
ls -l /etc/kubernetes/manifestsEdit the one corresponding to the API server:
sudo vim /etc/kubernetes/manifests/kube-apiserver.yaml
Adding the PSP admission plugin
There should already be a line with
--enable-admission-plugins=...Let's add
PodSecurityPolicyon that line
Locate the line with
--enable-admission-plugins=Add
PodSecurityPolicyIt should read:
--enable-admission-plugins=NodeRestriction,PodSecurityPolicySave, quit
Waiting for the API server to restart
The kubelet detects that the file was modified
It kills the API server pod, and starts a new one
During that time, the API server is unavailable
- Wait until the API server is available again
Check that the admission plugin is active
- Normally, we can't create any Pod at this point
- Try to create a Pod directly:kubectl run testpsp1 --image=nginx --restart=Never
Try to create a Deployment:
kubectl create deployment testpsp2 --image=nginxLook at existing resources:
kubectl get all
We can get hints at what's happening by looking at the ReplicaSet and Events.
Introducing our Pod Security Policies
We will create two policies:
privileged (allows everything)
restricted (blocks some unsafe mechanisms)
For each policy, we also need an associated ClusterRole granting use
Creating our Pod Security Policies
We have a couple of files, each defining a PSP and associated ClusterRole:
- k8s/psp-privileged.yaml: policy
privileged, rolepsp:privileged - k8s/psp-restricted.yaml: policy
restricted, rolepsp:restricted
- k8s/psp-privileged.yaml: policy
- Create both policies and their associated ClusterRoles:kubectl create -f ~/container.training/k8s/psp-restricted.yamlkubectl create -f ~/container.training/k8s/psp-privileged.yaml
The privileged policy comes from the Kubernetes documentation
The restricted policy is inspired by that same documentation page
Check that we can create Pods again
We haven't bound the policy to any user yet
But
cluster-admincan implicitlyuseall policies
Check that we can now create a Pod directly:
kubectl run testpsp3 --image=nginx --restart=NeverCreate a Deployment as well:
kubectl create deployment testpsp4 --image=nginxConfirm that the Deployment is not creating any Pods:
kubectl get all
What's going on?
We can create Pods directly (thanks to our root-like permissions)
The Pods corresponding to a Deployment are created by the ReplicaSet controller
The ReplicaSet controller does not have root-like permissions
We need to either:
- grant permissions to the ReplicaSet controller
or
- grant permissions to our Pods' ServiceAccount
The first option would allow anyone to create pods
The second option will allow us to scope the permissions better
Binding the restricted policy
Let's bind the role
psp:restrictedto ServiceAccountgreen:default(aka the default ServiceAccount in the green Namespace)
This will allow Pod creation in the green Namespace
(because these Pods will be using that ServiceAccount automatically)
- Create the following RoleBinding:kubectl create rolebinding psp:restricted \--clusterrole=psp:restricted \--serviceaccount=green:default
Trying it out
The Deployments that we created earlier will eventually recover
(the ReplicaSet controller will retry to create Pods once in a while)
If we create a new Deployment now, it should work immediately
Create a simple Deployment:
kubectl create deployment testpsp5 --image=nginxLook at the Pods that have been created:
kubectl get all
Trying to hack the cluster
- Let's create the same DaemonSet we used earlier
Create a hostile DaemonSet:
kubectl create -f ~/container.training/k8s/hacktheplanet.yamlLook at the state of the namespace:
kubectl get all
What's in our restricted policy?
The restricted PSP is similar to the one provided in the docs, but:
it allows containers to run as root
it doesn't drop capabilities
Many containers run as root by default, and would require additional tweaks
Many containers use e.g.
chown, which requires a specific capability(that's the case for the NGINX official image, for instance)
We still block: hostPath, privileged containers, and much more!
The case of static pods
If we list the pods in the
kube-systemnamespace,kube-apiserveris missingHowever, the API server is obviously running
(otherwise,
kubectl get pods --namespace=kube-systemwouldn't work)The API server Pod is created directly by kubelet
(without going through the PSP admission plugin)
Then, kubelet creates a "mirror pod" representing that Pod in etcd
That "mirror pod" creation goes through the PSP admission plugin
And it gets blocked!
This can be fixed by binding
psp:privilegedto groupsystem:nodes
Before moving on...
Our cluster is currently broken
(we can't create pods in namespaces kube-system, default, ...)
We need to either:
disable the PSP admission plugin
allow use of PSP to relevant users and groups
For instance, we could:
bind
psp:restrictedto the groupsystem:authenticatedbind
psp:privilegedto the ServiceAccountkube-system:default
Fixing the cluster
- Let's disable the PSP admission plugin
Edit the Kubernetes API server static pod manifest
Remove the PSP admission plugin
This can be done with this one-liner:
sudo sed -i s/,PodSecurityPolicy// /etc/kubernetes/manifests/kube-apiserver.yaml
:EN:- Preventing privilege escalation with Pod Security Policies :FR:- Limiter les droits des conteneurs avec les Pod Security Policies
Generating user certificates
(automatically generated title slide)
Generating user certificates
The most popular ways to authenticate users with Kubernetes are:
TLS certificates
JSON Web Tokens (OIDC or ServiceAccount tokens)
We're going to see how to use TLS certificates
We will generate a certificate for an user and give them some permissions
Then we will use that certificate to access the cluster
Heads up!
The demos in this section require that we have access to our cluster's CA
This is easy if we are using a cluster deployed with
kubeadmOtherwise, we may or may not have access to the cluster's CA
We may or may not be able to use the CSR API instead
Check that we have access to the CA
Make sure that you are logged on the node hosting the control plane
(if a cluster has been provisioned for you for a training, it's
node1)
- Check that the CA key is here:sudo ls -l /etc/kubernetes/pki
The output should include ca.key and ca.crt.
How it works
The API server is configured to accept all certificates signed by a given CA
The certificate contains:
the user name (in the
CNfield)the groups the user belongs to (as multiple
Ofields)
- Check which CA is used by the Kubernetes API server:sudo grep crt /etc/kubernetes/manifests/kube-apiserver.yaml
This is the flag that we're looking for:
--client-ca-file=/etc/kubernetes/pki/ca.crtGenerating a key and CSR for our user
These operations could be done on a separate machine
We only need to transfer the CSR (Certificate Signing Request) to the CA
(we never need to expoes the private key)
Generate a private key:
openssl genrsa 4096 > user.keyGenerate a CSR:
openssl req -new -key user.key -subj /CN=jerome/O=devs/O=ops > user.csr
Generating a signed certificate
This has to be done on the machine holding the CA private key
(copy the
user.csrfile if needed)
Verify the CSR paramters:
openssl req -in user.csr -text | headGenerate the certificate:
sudo openssl x509 -req \-CA /etc/kubernetes/pki/ca.crt -CAkey /etc/kubernetes/pki/ca.key \-in user.csr -days 1 -set_serial 1234 > user.crt
If you are using two separate machines, transfer user.crt to the other machine.
Adding the key and certificate to kubeconfig
We have to edit our
.kube/configfileThis can be done relatively easily with
kubectl config
- Create a new
userentry in our.kube/configfile:kubectl config set-credentials jerome \--client-key=user.key --client-certificate=user.crt
The configuration file now points to our local files.
We could also embed the key and certs with the --embed-certs option.
(So that the kubeconfig file can be used without user.key and user.crt.)
Using the new identity
At the moment, we probably use the admin certificate generated by
kubeadm(with
CN=kubernetes-adminandO=system:masters)Let's edit our context to use our new certificate instead!
Edit the context:
kubectl config set-context --current --user=jeromeTry any command:
kubectl get pods
Access will be denied, but we should see that were correctly authenticated as jerome.
Granting permissions
- Let's add some read-only permissions to the
devsgroup (for instance)
Switch back to our admin identity:
kubectl config set-context --current --user=kubernetes-adminGrant permissions:
kubectl create clusterrolebinding devs-can-view \--clusterrole=view --group=devs
Testing the new permissions
As soon as we create the ClusterRoleBinding, all users in the
devsgroup get accessLet's verify that we can e.g. list pods!
Switch to our user identity again:
kubectl config set-context --current --user=jeromeTest the permissions:
kubectl get pods
:EN:- Authentication with user certificates :FR:- Identification par certificat TLS
The CSR API
(automatically generated title slide)
The CSR API
The Kubernetes API exposes CSR resources
We can use these resources to issue TLS certificates
First, we will go through a quick reminder about TLS certificates
Then, we will see how to obtain a certificate for a user
We will use that certificate to authenticate with the cluster
Finally, we will grant some privileges to that user
Reminder about TLS
TLS (Transport Layer Security) is a protocol providing:
encryption (to prevent eavesdropping)
authentication (using public key cryptography)
When we access an https:// URL, the server authenticates itself
(it proves its identity to us; as if it were "showing its ID")
But we can also have mutual TLS authentication (mTLS)
(client proves its identity to server; server proves its identity to client)
Authentication with certificates
To authenticate, someone (client or server) needs:
a private key (that remains known only to them)
a public key (that they can distribute)
a certificate (associating the public key with an identity)
A message encrypted with the private key can only be decrypted with the public key
(and vice versa)
If I use someone's public key to encrypt/decrypt their messages,
I can be certain that I am talking to them / they are talking to meThe certificate proves that I have the correct public key for them
Certificate generation workflow
This is what I do if I want to obtain a certificate.
Create public and private keys.
Create a Certificate Signing Request (CSR).
(The CSR contains the identity that I claim and a public key.)
Send that CSR to the Certificate Authority (CA).
The CA verifies that I can claim the identity in the CSR.
The CA generates my certificate and gives it to me.
The CA (or anyone else) never needs to know my private key.
The CSR API
The Kubernetes API has a CertificateSigningRequest resource type
(we can list them with e.g.
kubectl get csr)We can create a CSR object
(= upload a CSR to the Kubernetes API)
Then, using the Kubernetes API, we can approve/deny the request
If we approve the request, the Kubernetes API generates a certificate
The certificate gets attached to the CSR object and can be retrieved
Using the CSR API
We will show how to use the CSR API to obtain user certificates
This will be a rather complex demo
... And yet, we will take a few shortcuts to simplify it
(but it will illustrate the general idea)
The demo also won't be automated
(we would have to write extra code to make it fully functional)
Warning
The CSR API isn't really suited to issue user certificates
It is primarily intended to issue control plane certificates
(for instance, deal with kubelet certificates renewal)
The API was expanded a bit in Kubernetes 1.19 to encompass broader usage
There are still lots of gaps in the spec
(e.g. how to specify expiration in a standard way)
... And no other implementation to this date
(but cert-manager might eventually get there!)
General idea
We will create a Namespace named "users"
Each user will get a ServiceAccount in that Namespace
That ServiceAccount will give read/write access to one CSR object
Users will use that ServiceAccount's token to submit a CSR
We will approve the CSR (or not)
Users can then retrieve their certificate from their CSR object
...And use that certificate for subsequent interactions
Resource naming
For a user named jean.doe, we will have:
ServiceAccount
jean.doein NamespaceusersCertificateSigningRequest
user=jean.doeClusterRole
user=jean.doegiving read/write access to that CSRClusterRoleBinding
user=jean.doebinding ClusterRole and ServiceAccount
About resource name constraints
Most Kubernetes identifiers and names are fairly restricted
They generally are DNS-1123 labels or subdomains (from RFC 1123)
A label is lowercase letters, numbers, dashes; can't start or finish with a dash
A subdomain is one or multiple labels separated by dots
Some resources have more relaxed constraints, and can be "path segment names"
(uppercase are allowed, as well as some characters like
#:?!,_)This includes RBAC objects (like Roles, RoleBindings...) and CSRs
See the Identifiers and Names design document and the Object Names and IDs documentation page for more details
Creating the user's resources
If you want to use another name than jean.doe, update the YAML file!
Create the global namespace for all users:
kubectl create namespace usersCreate the ServiceAccount, ClusterRole, ClusterRoleBinding for
jean.doe:kubectl apply -f ~/container.training/k8s/user=jean.doe.yaml
Extracting the user's token
Let's obtain the user's token and give it to them
(the token will be their password)
List the user's secrets:
kubectl --namespace=users describe serviceaccount jean.doeShow the user's token:
kubectl --namespace=users describe secret jean.doe-token-xxxxx
Configure kubectl to use the token
- Let's create a new context that will use that token to access the API
Add a new identity to our kubeconfig file:
kubectl config set-credentials token:jean.doe --token=...Add a new context using that identity:
kubectl config set-context jean.doe --user=token:jean.doe --cluster=kubernetes(Make sure to adapt the cluster name if yours is different!)
Use that context:
kubectl config use-context jean.doe
Access the API with the token
- Let's check that our access rights are set properly
Try to access any resource:
kubectl get pods(This should tell us "Forbidden")
Try to access "our" CertificateSigningRequest:
kubectl get csr user=jean.doe(This should tell us "NotFound")
Create a key and a CSR
There are many tools to generate TLS keys and CSRs
Let's use OpenSSL; it's not the best one, but it's installed everywhere
(many people prefer cfssl, easyrsa, or other tools; that's fine too!)
- Generate the key and certificate signing request:openssl req -newkey rsa:2048 -nodes -keyout key.pem \-new -subj /CN=jean.doe/O=devs/ -out csr.pem
The command above generates:
- a 2048-bit RSA key, without encryption, stored in key.pem
- a CSR for the name
jean.doein groupdevs
Inside the Kubernetes CSR object
The Kubernetes CSR object is a thin wrapper around the CSR PEM file
The PEM file needs to be encoded to base64 on a single line
(we will use
base64 -w0for that purpose)The Kubernetes CSR object also needs to list the right "usages"
(these are flags indicating how the certificate can be used)
Sending the CSR to Kubernetes
- Generate and create the CSR resource:kubectl apply -f - <<EOFapiVersion: certificates.k8s.io/v1beta1kind: CertificateSigningRequestmetadata:name: user=jean.doespec:request: $(base64 -w0 < csr.pem)usages:- digital signature- key encipherment- client authEOF
Adjusting certificate expiration
By default, the CSR API generates certificates valid 1 year
We want to generate short-lived certificates, so we will lower that to 1 hour
Fow now, this is configured through an experimental controller manager flag
Edit the static pod definition for the controller manager:
sudo vim /etc/kubernetes/manifests/kube-controller-manager.yamlIn the list of flags, add the following line:
- --experimental-cluster-signing-duration=1h
Verifying and approving the CSR
- Let's inspect the CSR, and if it is valid, approve it
Switch back to
cluster-admin:kctx -Inspect the CSR:
kubectl describe csr user=jean.doeApprove it:
kubectl certificate approve user=jean.doe
Obtaining the certificate
Switch back to the user's identity:
kctx -Retrieve the updated CSR object and extract the certificate:
kubectl get csr user=jean.doe \-o jsonpath={.status.certificate} \| base64 -d > cert.pemInspect the certificate:
openssl x509 -in cert.pem -text -noout
Using the certificate
Add the key and certificate to kubeconfig:
kubectl config set-credentials cert:jean.doe --embed-certs \--client-certificate=cert.pem --client-key=key.pemUpdate the user's context to use the key and cert to authenticate:
kubectl config set-context jean.doe --user cert:jean.doeConfirm that we are seen as
jean.doe(but don't have permissions):kubectl get pods
What's missing?
We have just shown, step by step, a method to issue short-lived certificates for users.
To be usable in real environments, we would need to add:
a kubectl helper to automatically generate the CSR and obtain the cert
(and transparently renew the cert when needed)
a Kubernetes controller to automatically validate and approve CSRs
(checking that the subject and groups are valid)
a way for the users to know the groups to add to their CSR
(e.g.: annotations on their ServiceAccount + read access to the ServiceAccount)
Is this realistic?
Larger organizations typically integrate with their own directory
The general principle, however, is the same:
users have long-term credentials (password, token, ...)
they use these credentials to obtain other, short-lived credentials
This provides enhanced security:
the long-term credentials can use long passphrases, 2FA, HSM...
the short-term credentials are more convenient to use
we get strong security and convenience
Systems like Vault also have certificate issuance mechanisms
:EN:- Generating user certificates with the CSR API :FR:- Génération de certificats utilisateur avec la CSR API
OpenID Connect
(automatically generated title slide)
OpenID Connect
The Kubernetes API server can perform authentication with OpenID connect
This requires an OpenID provider
(external authorization server using the OAuth 2.0 protocol)
We can use a third-party provider (e.g. Google) or run our own (e.g. Dex)
We are going to give an overview of the protocol
We will show it in action (in a simplified scenario)
Workflow overview
We want to access our resources (a Kubernetes cluster)
We authenticate with the OpenID provider
we can do this directly (e.g. by going to https://accounts.google.com)
or maybe a kubectl plugin can open a browser page on our behalf
After authenticating us, the OpenID provider gives us:
an id token (a short-lived signed JSON Web Token, see next slide)
a refresh token (to renew the id token when needed)
We can now issue requests to the Kubernetes API with the id token
The API server will verify that token's content to authenticate us
JSON Web Tokens
A JSON Web Token (JWT) has three parts:
a header specifying algorithms and token type
a payload (indicating who issued the token, for whom, which purposes...)
a signature generated by the issuer (the issuer = the OpenID provider)
Anyone can verify a JWT without contacting the issuer
(except to obtain the issuer's public key)
Pro tip: we can inspect a JWT with https://jwt.io/
How the Kubernetes API uses JWT
Server side
enable OIDC authentication
indicate which issuer (provider) should be allowed
indicate which audience (or "client id") should be allowed
optionally, map or prefix user and group names
Client side
obtain JWT as described earlier
pass JWT as authentication token
renew JWT when needed (using the refresh token)
Demo time!
We will use Google Accounts as our OpenID provider
We will use the Google OAuth Playground as the "audience" or "client id"
We will obtain a JWT through Google Accounts and the OAuth Playground
We will enable OIDC in the Kubernetes API server
We will use the JWT to authenticate
If you can't or won't use a Google account, you can try to adapt this to another provider.
Checking the API server logs
The API server logs will be particularly useful in this section
(they will indicate e.g. why a specific token is rejected)
Let's keep an eye on the API server output!
- Tail the logs of the API server:kubectl logs kube-apiserver-node1 --follow --namespace=kube-system
Authenticate with the OpenID provider
We will use the Google OAuth Playground for convenience
In a real scenario, we would need our own OAuth client instead of the playground
(even if we were still using Google as the OpenID provider)
Open the Google OAuth Playground:
https://developers.google.com/oauthplayground/Enter our own custom scope in the text field:
https://www.googleapis.com/auth/userinfo.emailClick on "Authorize APIs" and allow the playground to access our email address
Obtain our JSON Web Token
The previous step gave us an "authorization code"
We will use it to obtain tokens
- Click on "Exchange authorization code for tokens"
The JWT is the very long
id_tokenthat shows up on the right hand side(it is a base64-encoded JSON object, and should therefore start with
eyJ)
Using our JSON Web Token
We need to create a context (in kubeconfig) for our token
(if we just add the token or use
kubectl --token, our certificate will still be used)
Create a new authentication section in kubeconfig:
kubectl config set-credentials myjwt --token=eyJ...Try to use it:
kubectl --user=myjwt get nodes
We should get an Unauthorized response, since we haven't enabled OpenID Connect in the API server yet. We should also see invalid bearer token in the API server log output.
Enabling OpenID Connect
We need to add a few flags to the API server configuration
These two are mandatory:
--oidc-issuer-url→ URL of the OpenID provider--oidc-client-id→ app requesting the authentication
(in our case, that's the ID for the Google OAuth Playground)This one is optional:
--oidc-username-claim→ which field should be used as user name
(we will use the user's email address instead of an opaque ID)See the API server documentation for more details about all available flags
Updating the API server configuration
The instructions below will work for clusters deployed with kubeadm
(or where the control plane is deployed in static pods)
If your cluster is deployed differently, you will need to adapt them
Edit
/etc/kubernetes/manifests/kube-apiserver.yamlAdd the following lines to the list of command-line flags:
- --oidc-issuer-url=https://accounts.google.com- --oidc-client-id=407408718192.apps.googleusercontent.com- --oidc-username-claim=email
Restarting the API server
The kubelet monitors the files in
/etc/kubernetes/manifestsWhen we save the pod manifest, kubelet will restart the corresponding pod
(using the updated command line flags)
After making the changes described on the previous slide, save the file
Issue a simple command (like
kubectl version) until the API server is back up(it might take between a few seconds and one minute for the API server to restart)
Restart the
kubectl logscommand to view the logs of the API server
Using our JSON Web Token
- Now that the API server is set up to recognize our token, try again!
- Try an API command with our token:kubectl --user=myjwt get nodeskubectl --user=myjwt get pods
We should see a message like:
Error from server (Forbidden): nodes is forbidden: User "jean.doe@gmail.com"cannot list resource "nodes" in API group "" at the cluster scope→ We were successfully authenticated, but not authorized.
Authorizing our user
As an extra step, let's grant read access to our user
We will use the pre-defined ClusterRole
view
Create a ClusterRoleBinding allowing us to view resources:
kubectl create clusterrolebinding i-can-view \--user=jean.doe@gmail.com --clusterrole=view(make sure to put your Google email address there)
Confirm that we can now list pods with our token:
kubectl --user=myjwt get pods
From demo to production
This was a very simplified demo! In a real deployment...
We wouldn't use the Google OAuth Playground
We probably wouldn't even use Google at all
(it doesn't seem to provide a way to include groups!)
Some popular alternatives:
We would use a helper (like the kubelogin plugin) to automatically obtain tokens
Service Account tokens
The tokens used by Service Accounts are JWT tokens as well
They are signed and verified using a special service account key pair
Extract the token of a service account in the current namespace:
kubectl get secrets -o jsonpath={..token} | base64 -dCopy-paste the token to a verification service like https://jwt.io
Notice that it says "Invalid Signature"
Verifying Service Account tokens
JSON Web Tokens embed the URL of the "issuer" (=OpenID provider)
The issuer provides its public key through a well-known discovery endpoint
(similar to https://accounts.google.com/.well-known/openid-configuration)
There is no such endpoint for the Service Account key pair
But we can provide the public key ourselves for verification
Verifying a Service Account token
On clusters provisioned with kubeadm, the Service Account key pair is:
/etc/kubernetes/pki/sa.key(used by the controller manager to generate tokens)/etc/kubernetes/pki/sa.pub(used by the API server to validate the same tokens)
Display the public key used to sign Service Account tokens:
sudo cat /etc/kubernetes/pki/sa.pubCopy-paste the key in the "verify signature" area on https://jwt.io
It should now say "Signature Verified"
:EN:- Authenticating with OIDC :FR:- S'identifier avec OIDC
Securing the control plane
(automatically generated title slide)
Securing the control plane
Many components accept connections (and requests) from others:
API server
etcd
kubelet
We must secure these connections:
to deny unauthorized requests
to prevent eavesdropping secrets, tokens, and other sensitive information
Disabling authentication and/or authorization is strongly discouraged
(but it's possible to do it, e.g. for learning / troubleshooting purposes)
Authentication and authorization
Authentication (checking "who you are") is done with mutual TLS
(both the client and the server need to hold a valid certificate)
Authorization (checking "what you can do") is done in different ways
the API server implements a sophisticated permission logic (with RBAC)
some services will defer authorization to the API server (through webhooks)
some services require a certificate signed by a particular CA / sub-CA
In practice
We will review the various communication channels in the control plane
We will describe how they are secured
When TLS certificates are used, we will indicate:
which CA signs them
what their subject (CN) should be, when applicable
We will indicate how to configure security (client- and server-side)
etcd peers
Replication and coordination of etcd happens on a dedicated port
(typically port 2380; the default port for normal client connections is 2379)
Authentication uses TLS certificates with a separate sub-CA
(otherwise, anyone with a Kubernetes client certificate could access etcd!)
The etcd command line flags involved are:
--peer-client-cert-auth=trueto activate it--peer-cert-file,--peer-key-file,--peer-trusted-ca-file
etcd clients
The only¹ thing that connects to etcd is the API server
Authentication uses TLS certificates with a separate sub-CA
(for the same reasons as for etcd inter-peer authentication)
The etcd command line flags involved are:
--client-cert-auth=trueto activate it--trusted-ca-file,--cert-file,--key-fileThe API server command line flags involved are:
--etcd-cafile,--etcd-certfile,--etcd-keyfile
¹Technically, there is also the etcd healthcheck. Let's ignore it for now.
etcd authorization
etcd supports RBAC, but Kubernetes doesn't use it by default
(note: etcd RBAC is completely different from Kubernetes RBAC!)
By default, etcd access is "all or nothing"
(if you have a valid certificate, you get in)
Be very careful if you use the same root CA for etcd and other things
(if etcd trusts the root CA, then anyone with a valid cert gets full etcd access)
For more details, check the following resources:
PKI The Wrong Way at KubeCon NA 2020
API server clients
The API server has a sophisticated authentication and authorization system
For connections coming from other components of the control plane:
authentication uses certificates (trusting the certificates' subject or CN)
authorization uses whatever mechanism is enabled (most oftentimes, RBAC)
The relevant API server flags are:
--client-ca-file,--tls-cert-file,--tls-private-key-fileEach component connecting to the API server takes a
--kubeconfigflag(to specify a kubeconfig file containing the CA cert, client key, and client cert)
Yes, that kubeconfig file follows the same format as our
~/.kube/configfile!
Kubelet and API server
Communication between kubelet and API server can be established both ways
Kubelet → API server:
kubelet registers itself ("hi, I'm node42, do you have work for me?")
connection is kept open and re-established if it breaks
that's how the kubelet knows which pods to start/stop
API server → kubelet:
- used to retrieve logs, exec, attach to containers
Kubelet → API server
Kubelet is started with
--kubeconfigwith API server informationThe client certificate of the kubelet will typically have:
CN=system:node:<nodename>and groupsO=system:nodesNothing special on the API server side
(it will authenticate like any other client)
API server → kubelet
Kubelet is started with the flag
--client-ca-file(typically using the same CA as the API server)
API server will use a dedicated key pair when contacting kubelet
(specified with
--kubelet-client-certificateand--kubelet-client-key)Authorization uses webhooks
(enabled with
--authorization-mode=Webhookon kubelet)The webhook server is the API server itself
(the kubelet sends back a request to the API server to ask, "can this person do that?")
Scheduler
The scheduler connects to the API server like an ordinary client
The certificate of the scheduler will have
CN=system:kube-scheduler
Controller manager
The controller manager is also a normal client to the API server
Its certificate will have
CN=system:kube-controller-managerIf we use the CSR API, the controller manager needs the CA cert and key
(passed with flags
--cluster-signing-cert-fileand--cluster-signing-key-file)We usually want the controller manager to generate tokens for service accounts
These tokens deserve some details (on the next slide!)
How are these permissions set up?
A bunch of roles and bindings are defined as constants in the API server code:
They are created automatically when the API server starts:
We must use the correct Common Names (
CN) for the control plane certificates(since the bindings defined above refer to these common names)
Service account tokens
Each time we create a service account, the controller manager generates a token
These tokens are JWT tokens, signed with a particular key
These tokens are used for authentication with the API server
(and therefore, the API server needs to be able to verify their integrity)
This uses another keypair:
the private key (used for signature) is passed to the controller manager
(using flags--service-account-private-key-fileand--root-ca-file)the public key (used for verification) is passed to the API server
(using flag--service-account-key-file)
kube-proxy
kube-proxy is "yet another API server client"
In many clusters, it runs as a Daemon Set
In that case, it will have its own Service Account and associated permissions
It will authenticate using the token of that Service Account
Webhooks
We mentioned webhooks earlier; how does that really work?
The Kubernetes API has special resource types to check permissions
One of them is SubjectAccessReview
To check if a particular user can do a particular action on a particular resource:
we prepare a SubjectAccessReview object
we send that object to the API server
the API server responds with allow/deny (and optional explanations)
Using webhooks for authorization = sending SAR to authorize each request
Subject Access Review
Here is an example showing how to check if jean.doe can get some pods in kube-system:
kubectl -v9 create -f- <<EOFapiVersion: authorization.k8s.io/v1beta1kind: SubjectAccessReviewspec: user: jean.doe group: - foo - bar resourceAttributes: #group: blah.k8s.io namespace: kube-system resource: pods verb: get #name: web-xyz1234567-pqr89EOF:EN:- Control plane authentication :FR:- Sécurisation du plan de contrôle
Volumes
(automatically generated title slide)
Volumes
Volumes are special directories that are mounted in containers
Volumes can have many different purposes:
share files and directories between containers running on the same machine
share files and directories between containers and their host
centralize configuration information in Kubernetes and expose it to containers
manage credentials and secrets and expose them securely to containers
store persistent data for stateful services
access storage systems (like Ceph, EBS, NFS, Portworx, and many others)
Kubernetes volumes vs. Docker volumes
Kubernetes and Docker volumes are very similar
(the Kubernetes documentation says otherwise ...
but it refers to Docker 1.7, which was released in 2015!)Docker volumes allow us to share data between containers running on the same host
Kubernetes volumes allow us to share data between containers in the same pod
Both Docker and Kubernetes volumes enable access to storage systems
Kubernetes volumes are also used to expose configuration and secrets
Docker has specific concepts for configuration and secrets
(but under the hood, the technical implementation is similar)If you're not familiar with Docker volumes, you can safely ignore this slide!
Volumes ≠ Persistent Volumes
Volumes and Persistent Volumes are related, but very different!
Volumes:
appear in Pod specifications (we'll see that in a few slides)
do not exist as API resources (cannot do
kubectl get volumes)
Persistent Volumes:
are API resources (can do
kubectl get persistentvolumes)correspond to concrete volumes (e.g. on a SAN, EBS, etc.)
cannot be associated with a Pod directly; but through a Persistent Volume Claim
won't be discussed further in this section
Adding a volume to a Pod
We will start with the simplest Pod manifest we can find
We will add a volume to that Pod manifest
We will mount that volume in a container in the Pod
By default, this volume will be an
emptyDir(an empty directory)
It will "shadow" the directory where it's mounted
Our basic Pod
apiVersion: v1kind: Podmetadata: name: nginx-without-volumespec: containers: - name: nginx image: nginxThis is a MVP! (Minimum Viable Pod😉)
It runs a single NGINX container.
Trying the basic pod
- Create the Pod:kubectl create -f ~/container.training/k8s/nginx-1-without-volume.yaml
Get its IP address:
IPADDR=$(kubectl get pod nginx-without-volume -o jsonpath={.status.podIP})Send a request with curl:
curl $IPADDR
(We should see the "Welcome to NGINX" page.)
Adding a volume
We need to add the volume in two places:
at the Pod level (to declare the volume)
at the container level (to mount the volume)
We will declare a volume named
wwwNo type is specified, so it will default to
emptyDir(as the name implies, it will be initialized as an empty directory at pod creation)
In that pod, there is also a container named
nginxThat container mounts the volume
wwwto path/usr/share/nginx/html/
The Pod with a volume
apiVersion: v1kind: Podmetadata: name: nginx-with-volumespec: volumes: - name: www containers: - name: nginx image: nginx volumeMounts: - name: www mountPath: /usr/share/nginx/html/Trying the Pod with a volume
- Create the Pod:kubectl create -f ~/container.training/k8s/nginx-2-with-volume.yaml
Get its IP address:
IPADDR=$(kubectl get pod nginx-with-volume -o jsonpath={.status.podIP})Send a request with curl:
curl $IPADDR
(We should now see a "403 Forbidden" error page.)
Populating the volume with another container
Let's add another container to the Pod
Let's mount the volume in both containers
That container will populate the volume with static files
NGINX will then serve these static files
To populate the volume, we will clone the Spoon-Knife repository
this repository is https://github.com/octocat/Spoon-Knife
it's very popular (more than 100K stars!)
Sharing a volume between two containers
apiVersion: v1kind: Podmetadata: name: nginx-with-gitspec: volumes: - name: www containers: - name: nginx image: nginx volumeMounts: - name: www mountPath: /usr/share/nginx/html/ - name: git image: alpine command: [ "sh", "-c", "apk add git && git clone https://github.com/octocat/Spoon-Knife /www" ] volumeMounts: - name: www mountPath: /www/ restartPolicy: OnFailureSharing a volume, explained
We added another container to the pod
That container mounts the
wwwvolume on a different path (/www)It uses the
alpineimageWhen started, it installs
gitand clones theoctocat/Spoon-Kniferepository(that repository contains a tiny HTML website)
As a result, NGINX now serves this website
Trying the shared volume
This one will be time-sensitive!
We need to catch the Pod IP address as soon as it's created
Then send a request to it as fast as possible
- Watch the pods (so that we can catch the Pod IP address)kubectl get pods -o wide --watch
Shared volume in action
- Create the pod:kubectl create -f ~/container.training/k8s/nginx-3-with-git.yaml
- As soon as we see its IP address, access it:curl $IP
- A few seconds later, the state of the pod will change; access it again:curl $IP
The first time, we should see "403 Forbidden".
The second time, we should see the HTML file from the Spoon-Knife repository.
Explanations
Both containers are started at the same time
NGINX starts very quickly
(it can serve requests immediately)
But at this point, the volume is empty
(NGINX serves "403 Forbidden")
The other containers installs git and clones the repository
(this takes a bit longer)
When the other container is done, the volume holds the repository
(NGINX serves the HTML file)
The devil is in the details
The default
restartPolicyisAlwaysThis would cause our
gitcontainer to run again ... and again ... and again(with an exponential back-off delay, as explained in the documentation)
That's why we specified
restartPolicy: OnFailure
Inconsistencies
There is a short period of time during which the website is not available
(because the
gitcontainer hasn't done its job yet)With a bigger website, we could get inconsistent results
(where only a part of the content is ready)
In real applications, this could cause incorrect results
How can we avoid that?
Init Containers
We can define containers that should execute before the main ones
They will be executed in order
(instead of in parallel)
They must all succeed before the main containers are started
This is exactly what we need here!
Let's see one in action
See Init Containers documentation for all the details.
Defining Init Containers
apiVersion: v1kind: Podmetadata: name: nginx-with-initspec: volumes: - name: www containers: - name: nginx image: nginx volumeMounts: - name: www mountPath: /usr/share/nginx/html/ initContainers: - name: git image: alpine command: [ "sh", "-c", "apk add git && git clone https://github.com/octocat/Spoon-Knife /www" ] volumeMounts: - name: www mountPath: /www/Trying the init container
Create the pod:
kubectl create -f ~/container.training/k8s/nginx-4-with-init.yamlTry to send HTTP requests as soon as the pod comes up
This time, instead of "403 Forbidden" we get a "connection refused"
NGINX doesn't start until the git container has done its job
We never get inconsistent results
(a "half-ready" container)
Other uses of init containers
Load content
Generate configuration (or certificates)
Database migrations
Waiting for other services to be up
(to avoid flurry of connection errors in main container)
etc.
Volume lifecycle
The lifecycle of a volume is linked to the pod's lifecycle
This means that a volume is created when the pod is created
This is mostly relevant for
emptyDirvolumes(other volumes, like remote storage, are not "created" but rather "attached" )
A volume survives across container restarts
A volume is destroyed (or, for remote storage, detached) when the pod is destroyed
:EN:- Sharing data between containers with volumes :EN:- When and how to use Init Containers
:FR:- Partager des données grâce aux volumes :FR:- Quand et comment utiliser un Init Container
Building images with the Docker Engine
(automatically generated title slide)
Building images with the Docker Engine
Until now, we have built our images manually, directly on a node
We are going to show how to build images from within the cluster
(by executing code in a container controlled by Kubernetes)
We are going to use the Docker Engine for that purpose
To access the Docker Engine, we will mount the Docker socket in our container
After building the image, we will push it to our self-hosted registry
Resource specification for our builder pod
apiVersion: v1kind: Podmetadata: name: build-imagespec: restartPolicy: OnFailure containers: - name: docker-build image: docker env: - name: REGISTRY_PORT value: "3XXXX" command: ["sh", "-c"] args: - | apk add --no-cache git && mkdir /workspace && git clone https://github.com/jpetazzo/container.training /workspace && docker build -t localhost:$REGISTRY_PORT/worker /workspace/dockercoins/worker && docker push localhost:$REGISTRY_PORT/worker volumeMounts: - name: docker-socket mountPath: /var/run/docker.sock volumes: - name: docker-socket hostPath: path: /var/run/docker.sockBreaking down the pod specification (1/2)
restartPolicy: OnFailureprevents the build from running in an infinite lopoWe use the
dockerimage (so that thedockerCLI is available)We rely on the fact that the
dockerimage is based onalpine(which is why we use
apkto installgit)The port for the registry is passed through an environment variable
(this avoids repeating it in the specification, which would be error-prone)
The environment variable has to be a string, so the "s are mandatory!
Breaking down the pod specification (2/2)
The volume
docker-socketis declared with ahostPath, indicating a bind-mountIt is then mounted in the container onto the default Docker socket path
We show a interesting way to specify the commands to run in the container:
the command executed will be
sh -c <args>argsis a list of strings|is used to pass a multi-line string in the YAML file
Running our pod
- Let's try this out!
Check the port used by our self-hosted registry:
kubectl get svc registryEdit
~/container.training/k8s/docker-build.yamlto put the port numberSchedule the pod by applying the resource file:
kubectl apply -f ~/container.training/k8s/docker-build.yamlWatch the logs:
stern build-image
What's missing?
What do we need to change to make this production-ready?
Build from a long-running container (e.g. a
Deployment) triggered by web hooks(the payload of the web hook could indicate the repository to build)
Build a specific branch or tag; tag image accordingly
Handle repositories where the Dockerfile is not at the root
(or containing multiple Dockerfiles)
Expose build logs so that troubleshooting is straightforward
🤔 That seems like a lot of work!
That's why services like Docker Hub (with automated builds) are helpful.
They handle the whole "code repository → Docker image" workflow.
Things to be aware of
This is talking directly to a node's Docker Engine to build images
It bypasses resource allocation mechanisms used by Kubernetes
(but you can use taints and tolerations to dedicate builder nodes)
Be careful not to introduce conflicts when naming images
(e.g. do not allow the user to specify the image names!)
Your builds are going to be fast
(because they will leverage Docker's caching system)
Building images with Kaniko
(automatically generated title slide)
Building images with Kaniko
Kaniko is an open source tool to build container images within Kubernetes
It can build an image using any standard Dockerfile
The resulting image can be pushed to a registry or exported as a tarball
It doesn't require any particular privilege
(and can therefore run in a regular container in a regular pod)
This combination of features is pretty unique
(most other tools use different formats, or require elevated privileges)
Kaniko in practice
Kaniko provides an "executor image",
gcr.io/kaniko-project/executorWhen running that image, we need to specify at least:
the path to the build context (=the directory with our Dockerfile)
the target image name (including the registry address)
Simplified example:
docker run \-v ...:/workspace gcr.io/kaniko-project/executor \--context=/workspace \--destination=registry:5000/image_name:image_tag
Running Kaniko in a Docker container
- Let's build the image for the DockerCoins
workerservice with Kaniko
Find the port number for our self-hosted registry:
kubectl get svc registryPORT=$(kubectl get svc registry -o json | jq .spec.ports[0].nodePort)Run Kaniko:
docker run --net host \-v ~/container.training/dockercoins/worker:/workspace \gcr.io/kaniko-project/executor \--context=/workspace \--destination=127.0.0.1:$PORT/worker-kaniko:latest
We use --net host so that we can connect to the registry over 127.0.0.1.
Running Kaniko in a Kubernetes pod
We need to mount or copy the build context to the pod
We are going to build straight from the git repository
(to avoid depending on files sitting on a node, outside of containers)
We need to
git clonethe repository before running KanikoWe are going to use two containers sharing a volume:
a first container to
git clonethe repository to the volumea second container to run Kaniko, using the content of the volume
However, we need the first container to be done before running the second one
🤔 How could we do that?
Init Containers to the rescue
A pod can have a list of
initContainersinitContainersare executed in the specified orderEach Init Container needs to complete (exit) successfully
If any Init Container fails (non-zero exit status) the pod fails
(what happens next depends on the pod's
restartPolicy)After all Init Containers have run successfully, normal
containersare startedWe are going to execute the
git cloneoperation in an Init Container
Our Kaniko builder pod
apiVersion: v1kind: Podmetadata: name: kaniko-buildspec: initContainers: - name: git-clone image: alpine command: ["sh", "-c"] args: - | apk add --no-cache git && git clone git://github.com/jpetazzo/container.training /workspace volumeMounts: - name: workspace mountPath: /workspace containers: - name: build-image image: gcr.io/kaniko-project/executor:latest args: - "--context=/workspace/dockercoins/rng" - "--insecure" - "--destination=registry:5000/rng-kaniko:latest" volumeMounts: - name: workspace mountPath: /workspace volumes: - name: workspaceExplanations
We define a volume named
workspace(using the defaultemptyDirprovider)That volume is mounted to
/workspacein both our containersThe
git-cloneInit Container installsgitand runsgit cloneThe
build-imagecontainer executes KanikoWe use our self-hosted registry DNS name (
registry)We add
--insecureto use plain HTTP to talk to the registry
Running our Kaniko builder pod
- The YAML for the pod is in
k8s/kaniko-build.yaml
Create the pod:
kubectl apply -f ~/container.training/k8s/kaniko-build.yamlWatch the logs:
stern kaniko
Discussion
What should we use? The Docker build technique shown earlier? Kaniko? Something else?
The Docker build technique is simple, and has the potential to be very fast
However, it doesn't play nice with Kubernetes resource limits
Kaniko plays nice with resource limits
However, it's slower (there is no caching at all)
The ultimate building tool will probably be Jessica Frazelle's img builder
(it depends on upstream changes that are not in Kubernetes 1.11.2 yet)
But ... is it all about speed? (No!)
The big picture
For starters: the Docker Hub automated builds are very easy to set up
link a GitHub repository with the Docker Hub
each time you push to GitHub, an image gets build on the Docker Hub
If this doesn't work for you: why?
too slow (I'm far from
us-east-1!) → consider using your cloud provider's registryI'm not using a cloud provider → ok, perhaps you need to self-host then
I need fancy features (e.g. CI) → consider something like GitLab
Managing configuration
(automatically generated title slide)
Managing configuration
Some applications need to be configured (obviously!)
There are many ways for our code to pick up configuration:
command-line arguments
environment variables
configuration files
configuration servers (getting configuration from a database, an API...)
... and more (because programmers can be very creative!)
How can we do these things with containers and Kubernetes?
Passing configuration to containers
There are many ways to pass configuration to code running in a container:
baking it into a custom image
command-line arguments
environment variables
injecting configuration files
exposing it over the Kubernetes API
configuration servers
Let's review these different strategies!
Baking custom images
Put the configuration in the image
(it can be in a configuration file, but also
ENVorCMDactions)It's easy! It's simple!
Unfortunately, it also has downsides:
multiplication of images
different images for dev, staging, prod ...
minor reconfigurations require a whole build/push/pull cycle
Avoid doing it unless you don't have the time to figure out other options
Command-line arguments
Indicate what should run in the container
Pass
commandand/orargsin the container options in a Pod's templateBoth
commandandargsare arraysExample (source):
args:- "agent"- "-bootstrap-expect=3"- "-retry-join=provider=k8s label_selector=\"app=consul\" namespace=\"$(NS)\""- "-client=0.0.0.0"- "-data-dir=/consul/data"- "-server"- "-ui"
args or command?
Use
commandto override theENTRYPOINTdefined in the imageUse
argsto keep theENTRYPOINTdefined in the image(the parameters specified in
argsare added to theENTRYPOINT)In doubt, use
commandIt is also possible to use both
commandandargs(they will be strung together, just like
ENTRYPOINTandCMD)See the docs to see how they interact together
Command-line arguments, pros & cons
Works great when options are passed directly to the running program
(otherwise, a wrapper script can work around the issue)
Works great when there aren't too many parameters
(to avoid a 20-lines
argsarray)Requires documentation and/or understanding of the underlying program
("which parameters and flags do I need, again?")
Well-suited for mandatory parameters (without default values)
Not ideal when we need to pass a real configuration file anyway
Environment variables
Pass options through the
envmap in the container specificationExample:
env:- name: ADMIN_PORTvalue: "8080"- name: ADMIN_AUTHvalue: Basic- name: ADMIN_CREDvalue: "admin:0pensesame!"
value must be a string! Make sure that numbers and fancy strings are quoted.
🤔 Why this weird {name: xxx, value: yyy} scheme? It will be revealed soon!
The downward API
In the previous example, environment variables have fixed values
We can also use a mechanism called the downward API
The downward API allows exposing pod or container information
either through special files (we won't show that for now)
or through environment variables
The value of these environment variables is computed when the container is started
Remember: environment variables won't (can't) change after container start
Let's see a few concrete examples!
Exposing the pod's namespace
- name: MY_POD_NAMESPACE valueFrom: fieldRef: fieldPath: metadata.namespaceUseful to generate FQDN of services
(in some contexts, a short name is not enough)
For instance, the two commands should be equivalent:
curl api-backendcurl api-backend.$MY_POD_NAMESPACE.svc.cluster.local
Exposing the pod's IP address
- name: MY_POD_IP valueFrom: fieldRef: fieldPath: status.podIPUseful if we need to know our IP address
(we could also read it from
eth0, but this is more solid)
Exposing the container's resource limits
- name: MY_MEM_LIMIT valueFrom: resourceFieldRef: containerName: test-container resource: limits.memoryUseful for runtimes where memory is garbage collected
Example: the JVM
(the memory available to the JVM should be set with the
-Xmxflag)Best practice: set a memory limit, and pass it to the runtime
Note: recent versions of the JVM can do this automatically
(see JDK-8146115) and this blog post for detailed examples)
More about the downward API
This documentation page tells more about these environment variables
And this one explains the other way to use the downward API
(through files that get created in the container filesystem)
That second link also includes a list of all the fields that can be used with the downward API
Environment variables, pros and cons
Works great when the running program expects these variables
Works great for optional parameters with reasonable defaults
(since the container image can provide these defaults)
Sort of auto-documented
(we can see which environment variables are defined in the image, and their values)
Can be (ab)used with longer values ...
... You can put an entire Tomcat configuration file in an environment ...
... But should you?
(Do it if you really need to, we're not judging! But we'll see better ways.)
Injecting configuration files
Sometimes, there is no way around it: we need to inject a full config file
Kubernetes provides a mechanism for that purpose:
configmapsA configmap is a Kubernetes resource that exists in a namespace
Conceptually, it's a key/value map
(values are arbitrary strings)
We can think about them in (at least) two different ways:
as holding entire configuration file(s)
as holding individual configuration parameters
Note: to hold sensitive information, we can use "Secrets", which are another type of resource behaving very much like configmaps. We'll cover them just after!
Configmaps storing entire files
In this case, each key/value pair corresponds to a configuration file
Key = name of the file
Value = content of the file
There can be one key/value pair, or as many as necessary
(for complex apps with multiple configuration files)
Examples:
# Create a configmap with a single key, "app.conf"kubectl create configmap my-app-config --from-file=app.conf# Create a configmap with a single key, "app.conf" but another filekubectl create configmap my-app-config --from-file=app.conf=app-prod.conf# Create a configmap with multiple keys (one per file in the config.d directory)kubectl create configmap my-app-config --from-file=config.d/
Configmaps storing individual parameters
In this case, each key/value pair corresponds to a parameter
Key = name of the parameter
Value = value of the parameter
Examples:
# Create a configmap with two keyskubectl create cm my-app-config \--from-literal=foreground=red \--from-literal=background=blue# Create a configmap from a file containing key=val pairskubectl create cm my-app-config \--from-env-file=app.conf
Exposing configmaps to containers
Configmaps can be exposed as plain files in the filesystem of a container
this is achieved by declaring a volume and mounting it in the container
this is particularly effective for configmaps containing whole files
Configmaps can be exposed as environment variables in the container
this is achieved with the downward API
this is particularly effective for configmaps containing individual parameters
Let's see how to do both!
Passing a configuration file with a configmap
We will start a load balancer powered by HAProxy
We will use the official
haproxyimageIt expects to find its configuration in
/usr/local/etc/haproxy/haproxy.cfgWe will provide a simple HAproxy configuration,
k8s/haproxy.cfgIt listens on port 80, and load balances connections between IBM and Google
Creating the configmap
Go to the
k8sdirectory in the repository:cd ~/container.training/k8sCreate a configmap named
haproxyand holding the configuration file:kubectl create configmap haproxy --from-file=haproxy.cfgCheck what our configmap looks like:
kubectl get configmap haproxy -o yaml
Using the configmap
We are going to use the following pod definition:
apiVersion: v1kind: Podmetadata: name: haproxyspec: volumes: - name: config configMap: name: haproxy containers: - name: haproxy image: haproxy volumeMounts: - name: config mountPath: /usr/local/etc/haproxy/Using the configmap
- The resource definition from the previous slide is in
k8s/haproxy.yaml
- Create the HAProxy pod:kubectl apply -f ~/container.training/k8s/haproxy.yaml
- Check the IP address allocated to the pod:kubectl get pod haproxy -o wideIP=$(kubectl get pod haproxy -o json | jq -r .status.podIP)
Testing our load balancer
The load balancer will send:
half of the connections to Google
the other half to IBM
- Access the load balancer a few times:curl $IPcurl $IPcurl $IP
We should see connections served by Google, and others served by IBM.
(Each server sends us a redirect page. Look at the URL that they send us to!)
Exposing configmaps with the downward API
We are going to run a Docker registry on a custom port
By default, the registry listens on port 5000
This can be changed by setting environment variable
REGISTRY_HTTP_ADDRWe are going to store the port number in a configmap
Then we will expose that configmap as a container environment variable
Creating the configmap
Our configmap will have a single key,
http.addr:kubectl create configmap registry --from-literal=http.addr=0.0.0.0:80Check our configmap:
kubectl get configmap registry -o yaml
Using the configmap
We are going to use the following pod definition:
apiVersion: v1kind: Podmetadata: name: registryspec: containers: - name: registry image: registry env: - name: REGISTRY_HTTP_ADDR valueFrom: configMapKeyRef: name: registry key: http.addrUsing the configmap
- The resource definition from the previous slide is in
k8s/registry.yaml
- Create the registry pod:kubectl apply -f ~/container.training/k8s/registry.yaml
Check the IP address allocated to the pod:
kubectl get pod registry -o wideIP=$(kubectl get pod registry -o json | jq -r .status.podIP)Confirm that the registry is available on port 80:
curl $IP/v2/_catalog
:EN:- Managing application configuration :EN:- Exposing configuration with the downward API :EN:- Exposing configuration with Config Maps
:FR:- Gérer la configuration des applications :FR:- Configuration au travers de la downward API :FR:- Configurer les applications avec des Config Maps k8s/configuration.md
Managing secrets
(automatically generated title slide)
Managing secrets
Sometimes our code needs sensitive information:
passwords
API tokens
TLS keys
...
Secrets can be used for that purpose
Secrets and ConfigMaps are very similar
Similarities between ConfigMap and Secrets
ConfigMap and Secrets are key-value maps
(a Secret can contain zero, one, or many key-value pairs)
They can both be exposed with the downward API or volumes
They can both be created with YAML or with a CLI command
(
kubectl create configmap/kubectl create secret)
ConfigMap and Secrets are different resources
They can have different RBAC permissions
(e.g. the default
viewrole can read ConfigMaps but not Secrets)They indicate a different intent:
"You should use secrets for things which are actually secret like API keys, credentials, etc., and use config map for not-secret configuration data."
"In the future there will likely be some differentiators for secrets like rotation or support for backing the secret API w/ HSMs, etc."
(Source: the author of both features)
Secrets have an optional type
The type indicates which keys must exist in the secrets, for instance:
kubernetes.io/tlsrequirestls.crtandtls.keykubernetes.io/basic-authrequiresusernameandpasswordkubernetes.io/ssh-authrequiresssh-privatekeykubernetes.io/dockerconfigjsonrequires.dockerconfigjsonkubernetes.io/service-account-tokenrequirestoken,namespace,ca.crt(the whole list is in the documentation)
This is merely for our (human) convenience:
“Ah yes, this secret is a ...”
Accessing private repositories
Let's see how to access an image on private registry!
These images are protected by a username + password
(on some registries, it's token + password, but it's the same thing)
To access a private image, we need to:
create a secret
reference that secret in a Pod template
or reference that secret in a ServiceAccount used by a Pod
In practice
Let's try to access an image on a private registry!
- image = docker-registry.enix.io/jpetazzo/private:latest
- user = reader
- password = VmQvqdtXFwXfyy4Jb5DR
Create a Deployment using that image:
kubectl create deployment priv \--image=docker-registry.enix.io/jpetazzo/privateCheck that the Pod won't start:
kubectl get pods --selector=app=priv
Creating a secret
- Let's create a secret with the information provided earlier
- Create the registry secret:kubectl create secret docker-registry enix \--docker-server=docker-registry.enix.io \--docker-username=reader \--docker-password=VmQvqdtXFwXfyy4Jb5DR
Why do we have to specify the registry address?
If we use multiple sets of credentials for different registries, it prevents leaking the credentials of one registry to another registry.
Using the secret
The first way to use a secret is to add it to
imagePullSecrets(in the
specsection of a Pod template)
- Patch the
privDeployment that we created earlier:kubectl patch deploy priv --patch='spec:template:spec:imagePullSecrets:- name: enix'
Checking the results
- Confirm that our Pod can now start correctly:kubectl get pods --selector=app=priv
Another way to use the secret
We can add the secret to the ServiceAccount
This is convenient to automatically use credentials for all pods
(as long as they're using a specific ServiceAccount, of course)
- Add the secret to the ServiceAccount:kubectl patch serviceaccount default --patch='imagePullSecrets:- name: enix'
Secrets are displayed with base64 encoding
When shown with e.g.
kubectl get secrets -o yaml, secrets are base64-encodedLikewise, when defining it with YAML,
datavalues are base64-encodedExample:
kind: SecretapiVersion: v1metadata:name: pin-codesdata:onetwothreefour: MTIzNA==zerozerozerozero: MDAwMA==Keep in mind that this is just encoding, not encryption
It is very easy to automatically extract and decode secrets
Using stringData
When creating a Secret, it is possible to bypass base64
Just use
stringDatainstead ofdata:kind: SecretapiVersion: v1metadata:name: pin-codesstringData:onetwothreefour: 1234zerozerozerozero: 0000It will show up as base64 if you
kubectl get -o yamlNo
typewas specified, so it defaults toOpaque
Encryption at rest
It is possible to encrypted secrets at rest
This means that secrets will be safe if someone ...
steals our etcd servers
steals our backups
snoops the e.g. iSCSI link between our etcd servers and SAN
However, starting the API server will now require human intervention
(to provide the decryption keys)
This is only for extremely regulated environments (military, nation states...)
Immutable ConfigMaps and Secrets
Since Kubernetes 1.19, it is possible to mark a ConfigMap or Secret as immutable
kubectl patch configmap xyz --patch='{"immutable": true}'This brings performance improvements when using lots of ConfigMaps and Secrets
(lots = tens of thousands)
Once a ConfigMap or Secret has been marked as immutable:
- its content cannot be changed anymore
- the
immutablefield can't be changed back either - the only way to change it is to delete and re-create it
- Pods using it will have to be re-created as well
:EN:- Handling passwords and tokens safely
:FR:- Manipulation de mots de passe, clés API etc.
Stateful sets
(automatically generated title slide)
Stateful sets
Stateful sets are a type of resource in the Kubernetes API
(like pods, deployments, services...)
They offer mechanisms to deploy scaled stateful applications
At a first glance, they look like deployments:
a stateful set defines a pod spec and a number of replicas R
it will make sure that R copies of the pod are running
that number can be changed while the stateful set is running
updating the pod spec will cause a rolling update to happen
But they also have some significant differences
Stateful sets unique features
Pods in a stateful set are numbered (from 0 to R-1) and ordered
They are started and updated in order (from 0 to R-1)
A pod is started (or updated) only when the previous one is ready
They are stopped in reverse order (from R-1 to 0)
Each pod knows its identity (i.e. which number it is in the set)
Each pod can discover the IP address of the others easily
The pods can persist data on attached volumes
🤔 Wait a minute ... Can't we already attach volumes to pods and deployments?
Revisiting volumes
Volumes are used for many purposes:
sharing data between containers in a pod
exposing configuration information and secrets to containers
accessing storage systems
Let's see examples of the latter usage
Volumes types
There are many types of volumes available:
public cloud storage (GCEPersistentDisk, AWSElasticBlockStore, AzureDisk...)
private cloud storage (Cinder, VsphereVolume...)
traditional storage systems (NFS, iSCSI, FC...)
distributed storage (Ceph, Glusterfs, Portworx...)
Using a persistent volume requires:
creating the volume out-of-band (outside of the Kubernetes API)
referencing the volume in the pod description, with all its parameters
Using a cloud volume
Here is a pod definition using an AWS EBS volume (that has to be created first):
apiVersion: v1kind: Podmetadata: name: pod-using-my-ebs-volumespec: containers: - image: ... name: container-using-my-ebs-volume volumeMounts: - mountPath: /my-ebs name: my-ebs-volume volumes: - name: my-ebs-volume awsElasticBlockStore: volumeID: vol-049df61146c4d7901 fsType: ext4Using an NFS volume
Here is another example using a volume on an NFS server:
apiVersion: v1kind: Podmetadata: name: pod-using-my-nfs-volumespec: containers: - image: ... name: container-using-my-nfs-volume volumeMounts: - mountPath: /my-nfs name: my-nfs-volume volumes: - name: my-nfs-volume nfs: server: 192.168.0.55 path: "/exports/assets"Shortcomings of volumes
Their lifecycle (creation, deletion...) is managed outside of the Kubernetes API
(we can't just use
kubectl apply/create/delete/...to manage them)If a Deployment uses a volume, all replicas end up using the same volume
That volume must then support concurrent access
some volumes do (e.g. NFS servers support multiple read/write access)
some volumes support concurrent reads
some volumes support concurrent access for colocated pods
What we really need is a way for each replica to have its own volume
Individual volumes
The Pods of a Stateful set can have individual volumes
(i.e. in a Stateful set with 3 replicas, there will be 3 volumes)
These volumes can be either:
allocated from a pool of pre-existing volumes (disks, partitions ...)
created dynamically using a storage system
This introduces a bunch of new Kubernetes resource types:
Persistent Volumes, Persistent Volume Claims, Storage Classes
(and also
volumeClaimTemplates, that appear within Stateful Set manifests!)
Stateful set recap
A Stateful sets manages a number of identical pods
(like a Deployment)
These pods are numbered, and started/upgraded/stopped in a specific order
These pods are aware of their number
(e.g., #0 can decide to be the primary, and #1 can be secondary)
These pods can find the IP addresses of the other pods in the set
(through a headless service)
These pods can each have their own persistent storage
(Deployments cannot do that)
Running a Consul cluster
(automatically generated title slide)
Running a Consul cluster
Here is a good use-case for Stateful sets!
We are going to deploy a Consul cluster with 3 nodes
Consul is a highly-available key/value store
(like etcd or Zookeeper)
One easy way to bootstrap a cluster is to tell each node:
the addresses of other nodes
how many nodes are expected (to know when quorum is reached)
Bootstrapping a Consul cluster
After reading the Consul documentation carefully (and/or asking around), we figure out the minimal command-line to run our Consul cluster.
consul agent -data-dir=/consul/data -client=0.0.0.0 -server -ui \ -bootstrap-expect=3 \ -retry-join=X.X.X.X \ -retry-join=Y.Y.Y.YReplace X.X.X.X and Y.Y.Y.Y with the addresses of other nodes
A node can add its own address (it will work fine)
... Which means that we can use the same command-line on all nodes (convenient!)
Cloud Auto-join
Since version 1.4.0, Consul can use the Kubernetes API to find its peers
This is called Cloud Auto-join
Instead of passing an IP address, we need to pass a parameter like this:
consul agent -retry-join "provider=k8s label_selector=\"app=consul\""Consul needs to be able to talk to the Kubernetes API
We can provide a
kubeconfigfileIf Consul runs in a pod, it will use the service account of the pod k8s/statefulsets.md
Setting up Cloud auto-join
We need to create a service account for Consul
We need to create a role that can
listandgetpodsWe need to bind that role to the service account
And of course, we need to make sure that Consul pods use that service account
Putting it all together
The file
k8s/consul-1.yamldefines the required resources(service account, role, role binding, service, stateful set)
Inspired by this excellent tutorial by Kelsey Hightower
(many features from the original tutorial were removed for simplicity)
Running our Consul cluster
- We'll use the provided YAML file
Create the stateful set and associated service:
kubectl apply -f ~/container.training/k8s/consul-1.yamlCheck the logs as the pods come up one after another:
stern consul
- Check the health of the cluster:kubectl exec consul-0 -- consul members
Caveats
The scheduler may place two Consul pods on the same node
- if that node fails, we lose two Consul pods at the same time
- this will cause the cluster to fail
Scaling down the cluster will cause it to fail
- when a Consul member leaves the cluster, it needs to inform the others
- otherwise, the last remaining node doesn't have quorum and stops functioning
This Consul cluster doesn't use real persistence yet
- data is stored in the containers' ephemeral filesystem
- if a pod fails, its replacement starts from a blank slate
Improving pod placement
We need to tell the scheduler:
do not put two of these pods on the same node!
This is done with an
affinitysection like the following one:affinity:podAntiAffinity:requiredDuringSchedulingIgnoredDuringExecution:- labelSelector:matchLabels:app: consultopologyKey: kubernetes.io/hostname
Using a lifecycle hook
When a Consul member leaves the cluster, it needs to execute:
consul leaveThis is done with a
lifecyclesection like the following one:lifecycle:preStop:exec:command: [ "sh", "-c", "consul leave" ]
Running a better Consul cluster
Let's try to add the scheduling constraint and lifecycle hook
We can do that in the same namespace or another one (as we like)
If we do that in the same namespace, we will see a rolling update
(pods will be replaced one by one)
- Deploy a better Consul cluster:kubectl apply -f ~/container.training/k8s/consul-2.yaml
Still no persistence, though
We aren't using actual persistence yet
(no
volumeClaimTemplate, Persistent Volume, etc.)What happens if we lose a pod?
a new pod gets rescheduled (with an empty state)
the new pod tries to connect to the two others
it will be accepted (after 1-2 minutes of instability)
and it will retrieve the data from the other pods
Failure modes
What happens if we lose two pods?
manual repair will be required
we will need to instruct the remaining one to act solo
then rejoin new pods
What happens if we lose three pods? (aka all of them)
- we lose all the data (ouch)
If we run Consul without persistent storage, backups are a good idea!
Persistent Volumes Claims
(automatically generated title slide)
Persistent Volumes Claims
Our Pods can use a special volume type: a Persistent Volume Claim
A Persistent Volume Claim (PVC) is also a Kubernetes resource
(visible with
kubectl get persistentvolumeclaimsorkubectl get pvc)A PVC is not a volume; it is a request for a volume
It should indicate at least:
the size of the volume (e.g. "5 GiB")
the access mode (e.g. "read-write by a single pod")
What's in a PVC?
A PVC contains at least:
a list of access modes (ReadWriteOnce, ReadOnlyMany, ReadWriteMany)
a size (interpreted as the minimal storage space needed)
It can also contain optional elements:
a selector (to restrict which actual volumes it can use)
a storage class (used by dynamic provisioning, more on that later)
What does a PVC look like?
Here is a manifest for a basic PVC:
kind: PersistentVolumeClaimapiVersion: v1metadata: name: my-claimspec: accessModes: - ReadWriteOnce resources: requests: storage: 1GiUsing a Persistent Volume Claim
Here is a Pod definition like the ones shown earlier, but using a PVC:
apiVersion: v1kind: Podmetadata: name: pod-using-a-claimspec: containers: - image: ... name: container-using-a-claim volumeMounts: - mountPath: /my-vol name: my-volume volumes: - name: my-volume persistentVolumeClaim: claimName: my-claimCreating and using Persistent Volume Claims
PVCs can be created manually and used explicitly
(as shown on the previous slides)
They can also be created and used through Stateful Sets
(this will be shown later)
Lifecycle of Persistent Volume Claims
When a PVC is created, it starts existing in "Unbound" state
(without an associated volume)
A Pod referencing an unbound PVC will not start
(the scheduler will wait until the PVC is bound to place it)
A special controller continuously monitors PVCs to associate them with PVs
If no PV is available, one must be created:
manually (by operator intervention)
using a dynamic provisioner (more on that later)
Which PV gets associated to a PVC?
The PV must satisfy the PVC constraints
(access mode, size, optional selector, optional storage class)
The PVs with the closest access mode are picked
Then the PVs with the closest size
It is possible to specify a
claimRefwhen creating a PV(this will associate it to the specified PVC, but only if the PV satisfies all the requirements of the PVC; otherwise another PV might end up being picked)
For all the details about the PersistentVolumeClaimBinder, check this doc
Persistent Volume Claims and Stateful sets
A Stateful set can define one (or more)
volumeClaimTemplateEach
volumeClaimTemplatewill create one Persistent Volume Claim per podEach pod will therefore have its own individual volume
These volumes are numbered (like the pods)
Example:
- a Stateful set is named
db - it is scaled to replicas
- it has a
volumeClaimTemplatenameddata - then it will create pods
db-0,db-1,db-2 - these pods will have volumes named
data-db-0,data-db-1,data-db-2
- a Stateful set is named
Persistent Volume Claims are sticky
When updating the stateful set (e.g. image upgrade), each pod keeps its volume
When pods get rescheduled (e.g. node failure), they keep their volume
(this requires a storage system that is not node-local)
These volumes are not automatically deleted
(when the stateful set is scaled down or deleted)
If a stateful set is scaled back up later, the pods get their data back
Dynamic provisioners
A dynamic provisioner monitors unbound PVCs
It can create volumes (and the corresponding PV) on the fly
This requires the PVCs to have a storage class
(annotation
volume.beta.kubernetes.io/storage-provisioner)A dynamic provisioner only acts on PVCs with the right storage class
(it ignores the other ones)
Just like
LoadBalancerservices, dynamic provisioners are optional(i.e. our cluster may or may not have one pre-installed)
What's a Storage Class?
A Storage Class is yet another Kubernetes API resource
(visible with e.g.
kubectl get storageclassorkubectl get sc)It indicates which provisioner to use
(which controller will create the actual volume)
And arbitrary parameters for that provisioner
(replication levels, type of disk ... anything relevant!)
Storage Classes are required if we want to use dynamic provisioning
(but we can also create volumes manually, and ignore Storage Classes)
The default storage class
At most one storage class can be marked as the default class
(by annotating it with
storageclass.kubernetes.io/is-default-class=true)When a PVC is created, it will be annotated with the default storage class
(unless it specifies an explicit storage class)
This only happens at PVC creation
(existing PVCs are not updated when we mark a class as the default one)
Dynamic provisioning setup
This is how we can achieve fully automated provisioning of persistent storage.
Configure a storage system.
(It needs to have an API, or be capable of automated provisioning of volumes.)
Install a dynamic provisioner for this storage system.
(This is some specific controller code.)
Create a Storage Class for this system.
(It has to match what the dynamic provisioner is expecting.)
Annotate the Storage Class to be the default one.
Dynamic provisioning usage
After setting up the system (previous slide), all we need to do is:
Create a Stateful Set that makes use of a volumeClaimTemplate.
This will trigger the following actions.
The Stateful Set creates PVCs according to the
volumeClaimTemplate.The Stateful Set creates Pods using these PVCs.
The PVCs are automatically annotated with our Storage Class.
The dynamic provisioner provisions volumes and creates the corresponding PVs.
The PersistentVolumeClaimBinder associates the PVs and the PVCs together.
PVCs are now bound, the Pods can start.
:EN:- Deploying apps with Stateful Sets :EN:- Example: deploying a Consul cluster :EN:- Understanding Persistent Volume Claims and Storage Classes :FR:- Déployer une application avec un Stateful Set :FR:- Example : lancer un cluster Consul :FR:- Comprendre les Persistent Volume Claims et Storage Classes
Local Persistent Volumes
(automatically generated title slide)
Local Persistent Volumes
We want to run that Consul cluster and actually persist data
But we don't have a distributed storage system
We are going to use local volumes instead
(similar conceptually to
hostPathvolumes)We can use local volumes without installing extra plugins
However, they are tied to a node
If that node goes down, the volume becomes unavailable
k8s/local-persistent-volumes.md
With or without dynamic provisioning
We will deploy a Consul cluster with persistence
That cluster's StatefulSet will create PVCs
These PVCs will remain unbound¹, until we will create local volumes manually
(we will basically do the job of the dynamic provisioner)
Then, we will see how to automate that with a dynamic provisioner
¹Unbound = without an associated Persistent Volume.
k8s/local-persistent-volumes.md
If we have a dynamic provisioner ...
The labs in this section assume that we do not have a dynamic provisioner
If we do have one, we need to disable it
Check if we have a dynamic provisioner:
kubectl get storageclassIf the output contains a line with
(default), run this command:kubectl annotate sc storageclass.kubernetes.io/is-default-class- --allCheck again that it is no longer marked as
(default)
k8s/local-persistent-volumes.md
Deploying Consul
Let's use a new manifest for our Consul cluster
The only differences between that file and the previous one are:
volumeClaimTemplatedefined in the Stateful Set specthe corresponding
volumeMountsin the Pod spec
- Apply the persistent Consul YAML file:kubectl apply -f ~/container.training/k8s/consul-3.yaml
k8s/local-persistent-volumes.md
Observing the situation
- Let's look at Persistent Volume Claims and Pods
Check that we now have an unbound Persistent Volume Claim:
kubectl get pvcWe don't have any Persistent Volume:
kubectl get pvThe Pod
consul-0is not scheduled yet:kubectl get pods -o wide
Hint: leave these commands running with -w in different windows.
k8s/local-persistent-volumes.md
Explanations
In a Stateful Set, the Pods are started one by one
consul-1won't be created untilconsul-0is runningconsul-0has a dependency on an unbound Persistent Volume ClaimThe scheduler won't schedule the Pod until the PVC is bound
(because the PVC might be bound to a volume that is only available on a subset of nodes; for instance EBS are tied to an availability zone)
k8s/local-persistent-volumes.md
Creating Persistent Volumes
Let's create 3 local directories (
/mnt/consul) on node2, node3, node4Then create 3 Persistent Volumes corresponding to these directories
Create the local directories:
for NODE in node2 node3 node4; dossh $NODE sudo mkdir -p /mnt/consuldoneCreate the PV objects:
kubectl apply -f ~/container.training/k8s/volumes-for-consul.yaml
k8s/local-persistent-volumes.md
Check our Consul cluster
The PVs that we created will be automatically matched with the PVCs
Once a PVC is bound, its pod can start normally
Once the pod
consul-0has started,consul-1can be created, etc.Eventually, our Consul cluster is up, and backend by "persistent" volumes
- Check that our Consul clusters has 3 members indeed:kubectl exec consul-0 -- consul members
k8s/local-persistent-volumes.md
Devil is in the details (1/2)
The size of the Persistent Volumes is bogus
(it is used when matching PVs and PVCs together, but there is no actual quota or limit)
k8s/local-persistent-volumes.md
Devil is in the details (2/2)
This specific example worked because we had exactly 1 free PV per node:
if we had created multiple PVs per node ...
we could have ended with two PVCs bound to PVs on the same node ...
which would have required two pods to be on the same node ...
which is forbidden by the anti-affinity constraints in the StatefulSet
To avoid that, we need to associated the PVs with a Storage Class that has:
volumeBindingMode: WaitForFirstConsumer(this means that a PVC will be bound to a PV only after being used by a Pod)
See this blog post for more details
k8s/local-persistent-volumes.md
Bulk provisioning
It's not practical to manually create directories and PVs for each app
We could pre-provision a number of PVs across our fleet
We could even automate that with a Daemon Set:
creating a number of directories on each node
creating the corresponding PV objects
We also need to recycle volumes
... This can quickly get out of hand
k8s/local-persistent-volumes.md
Dynamic provisioning
We could also write our own provisioner, which would:
watch the PVCs across all namespaces
when a PVC is created, create a corresponding PV on a node
Or we could use one of the dynamic provisioners for local persistent volumes
(for instance the Rancher local path provisioner)
k8s/local-persistent-volumes.md
Strategies for local persistent volumes
Remember, when a node goes down, the volumes on that node become unavailable
High availability will require another layer of replication
(like what we've just seen with Consul; or primary/secondary; etc)
Pre-provisioning PVs makes sense for machines with local storage
(e.g. cloud instance storage; or storage directly attached to a physical machine)
Dynamic provisioning makes sense for large number of applications
(when we can't or won't dedicate a whole disk to a volume)
It's possible to mix both (using distinct Storage Classes)
:EN:- Static vs dynamic volume provisioning :EN:- Example: local persistent volume provisioner :FR:- Création statique ou dynamique de volumes :FR:- Exemple : création de volumes locaux
Highly available Persistent Volumes
(automatically generated title slide)
Highly available Persistent Volumes
How can we achieve true durability?
How can we store data that would survive the loss of a node?
Highly available Persistent Volumes
How can we achieve true durability?
How can we store data that would survive the loss of a node?
We need to use Persistent Volumes backed by highly available storage systems
There are many ways to achieve that:
leveraging our cloud's storage APIs
using NAS/SAN systems or file servers
distributed storage systems
We are going to see one distributed storage system in action
Our test scenario
We will set up a distributed storage system on our cluster
We will use it to deploy a SQL database (PostgreSQL)
We will insert some test data in the database
We will disrupt the node running the database
We will see how it recovers
Portworx
Portworx is a commercial persistent storage solution for containers
It works with Kubernetes, but also Mesos, Swarm ...
It provides hyper-converged storage
(=storage is provided by regular compute nodes)
We're going to use it here because it can be deployed on any Kubernetes cluster
(it doesn't require any particular infrastructure)
We don't endorse or support Portworx in any particular way
(but we appreciate that it's super easy to install!)
A useful reminder
We're installing Portworx because we need a storage system
If you are using AKS, EKS, GKE ... you already have a storage system
(but you might want another one, e.g. to leverage local storage)
If you have setup Kubernetes yourself, there are other solutions available too
on premises, you can use a good old SAN/NAS
on a private cloud like OpenStack, you can use e.g. Cinder
everywhere, you can use other systems, e.g. Gluster, StorageOS
Installing Portworx
Portworx installation is relatively simple
... But we made it even simpler!
We are going to use a YAML manifest that will take care of everything
Warning: this manifest is customized for a very specific setup
(like the VMs that we provide during workshops and training sessions)
It will probably not work If you are using a different setup
(like Docker Desktop, k3s, MicroK8S, Minikube ...)
The simplified Portworx installer
The Portworx installation will take a few minutes
Let's start it, then we'll explain what happens behind the scenes
- Install Portworx:kubectl apply -f ~/container.training/k8s/portworx.yaml
Note: this was tested with Kubernetes 1.18. Newer versions may or may not work.
What's in this YAML manifest?
Portworx installation itself, pre-configured for our setup
A default Storage Class using Portworx
A Daemon Set to create loop devices on each node of the cluster
Portworx installation
The official way to install Portworx is to use PX-Central
(this requires a free account)
PX-Central will ask us a few questions about our cluster
(Kubernetes version, on-prem/cloud deployment, etc.)
Using our answers, it will generate a YAML manifest that we can use
Portworx storage configuration
Portworx needs at least one block device
Block device = disk or partition on a disk
We can see block devices with
lsblk(or
cat /proc/partitionsif we're old school like that!)If we don't have a spare disk or partition, we can use a loop device
A loop device is a block device actually backed by a file
These are frequently used to mount ISO (CD/DVD) images or VM disk images
Setting up a loop device
Our
portworx.yamlmanifest includes a Daemon Set that will:create a 10 GB (empty) file on each node
load the
loopmodule (if it's not already loaded)associate a loop device with the 10 GB file
After these steps, we have a block device that Portworx can use
Implementation details
The file is
/portworx.blk(it is a sparse file created with
truncate)The loop device is
/dev/loop4This can be verified by running
sudo losetupThe Daemon Set uses a privileged Init Container
We can check the logs of that container with:
kubectl logs --selector=app=setup-loop4-for-portworx \-c setup-loop4-for-portworx
Waiting for Portworx to be ready
- The installation process will take a few minutes
Check out the logs:
stern -n kube-system portworxWait until it gets quiet
(you should see
portworx service is healthy, too)
Dynamic provisioning of persistent volumes
We are going to run PostgreSQL in a Stateful set
The Stateful set will specify a
volumeClaimTemplateThat
volumeClaimTemplatewill create Persistent Volume ClaimsKubernetes' dynamic provisioning will satisfy these Persistent Volume Claims
(by creating Persistent Volumes and binding them to the claims)
The Persistent Volumes are then available for the PostgreSQL pods
Storage Classes
It's possible that multiple storage systems are available
Or, that a storage system offers multiple tiers of storage
(SSD vs. magnetic; mirrored or not; etc.)
We need to tell Kubernetes which system and tier to use
This is achieved by creating a Storage Class
A
volumeClaimTemplatecan indicate which Storage Class to useIt is also possible to mark a Storage Class as "default"
(it will be used if a
volumeClaimTemplatedoesn't specify one)
Check our default Storage Class
- The YAML manifest applied earlier should define a default storage class
- Check that we have a default storage class:kubectl get storageclass
There should be a storage class showing as portworx-replicated (default).
Our default Storage Class
This is our Storage Class (in k8s/storage-class.yaml):
kind: StorageClassapiVersion: storage.k8s.io/v1beta1metadata: name: portworx-replicated annotations: storageclass.kubernetes.io/is-default-class: "true"provisioner: kubernetes.io/portworx-volumeparameters: repl: "2" priority_io: "high"It says "use Portworx to create volumes and keep 2 replicas of these volumes"
The annotation makes this Storage Class the default one
Our Postgres Stateful set
The next slide shows
k8s/postgres.yamlIt defines a Stateful set
With a
volumeClaimTemplaterequesting a 1 GB volumeThat volume will be mounted to
/var/lib/postgresql/dataThere is another little detail: we enable the
storkschedulerThe
storkscheduler is optional (it's specific to Portworx)It helps the Kubernetes scheduler to colocate the pod with its volume
(see this blog post for more details about that)
apiVersion: apps/v1kind: StatefulSetmetadata: name: postgresspec: selector: matchLabels: app: postgres serviceName: postgres template: metadata: labels: app: postgres spec: schedulerName: stork containers: - name: postgres image: postgres:12 env: - name: POSTGRES_HOST_AUTH_METHOD value: trust volumeMounts: - mountPath: /var/lib/postgresql/data name: postgres volumeClaimTemplates: - metadata: name: postgres spec: accessModes: ["ReadWriteOnce"] resources: requests: storage: 1GiCreating the Stateful set
- Before applying the YAML, watch what's going on with
kubectl get events -w
- Apply that YAML:kubectl apply -f ~/container.training/k8s/postgres.yaml
Testing our PostgreSQL pod
We will use
kubectl execto get a shell in the podGood to know: we need to use the
postgresuser in the pod
- Get a shell in the pod, as the
postgresuser:kubectl exec -ti postgres-0 -- su postgres
- Check that default databases have been created correctly:psql -l
(This should show us 3 lines: postgres, template0, and template1.)
Inserting data in PostgreSQL
- We will create a database and populate it with
pgbench
Create a database named
demo:createdb demoPopulate it with
pgbench:pgbench -i demo
The
-iflag means "create tables"If you want more data in the test tables, add e.g.
-s 10(to get 10x more rows)
Checking how much data we have now
- The
pgbenchtool inserts rows in tablepgbench_accounts
Check that the
demobase exists:psql -lCheck how many rows we have in
pgbench_accounts:psql demo -c "select count(*) from pgbench_accounts"Check that
pgbench_historyis currently empty:psql demo -c "select count(*) from pgbench_history"
Testing the load generator
- Let's use
pgbenchto generate a few transactions
Run
pgbenchfor 10 seconds, reporting progress every second:pgbench -P 1 -T 10 demoCheck the size of the history table now:
psql demo -c "select count(*) from pgbench_history"
Note: on small cloud instances, a typical speed is about 100 transactions/second.
Generating transactions
Now let's use
pgbenchto generate more transactionsWhile it's running, we will disrupt the database server
Run
pgbenchfor 10 minutes, reporting progress every second:pgbench -P 1 -T 600 demoYou can use a longer time period if you need more time to run the next steps
Find out which node is hosting the database
- We can find that information with
kubectl get pods -o wide
- Check the node running the database:kubectl get pod postgres-0 -o wide
We are going to disrupt that node.
Find out which node is hosting the database
- We can find that information with
kubectl get pods -o wide
- Check the node running the database:kubectl get pod postgres-0 -o wide
We are going to disrupt that node.
By "disrupt" we mean: "disconnect it from the network".
Disconnect the node
We will use
iptablesto block all traffic exiting the node(except SSH traffic, so we can repair the node later if needed)
SSH to the node to disrupt:
ssh nodeXAllow SSH traffic leaving the node, but block all other traffic:
sudo iptables -I OUTPUT -p tcp --sport 22 -j ACCEPTsudo iptables -I OUTPUT 2 -j DROP
Check that the node is disconnected
Check that the node can't communicate with other nodes:
ping node1Logout to go back on
node1
- Watch the events unfolding with
kubectl get events -wandkubectl get pods -w
It will take some time for Kubernetes to mark the node as unhealthy
Then it will attempt to reschedule the pod to another node
In about a minute, our pod should be up and running again
Check that our data is still available
- We are going to reconnect to the (new) pod and check
- Get a shell on the pod:kubectl exec -ti postgres-0 -- su postgres
- Check how many transactions are now in the
pgbench_historytable:psql demo -c "select count(*) from pgbench_history"
If the 10-second test that we ran earlier gave e.g. 80 transactions per second, and we failed the node after 30 seconds, we should have about 2400 row in that table.
Double-check that the pod has really moved
- Just to make sure the system is not bluffing!
- Look at which node the pod is now running onkubectl get pod postgres-0 -o wide
Re-enable the node
- Let's fix the node that we disconnected from the network
SSH to the node:
ssh nodeXRemove the iptables rule blocking traffic:
sudo iptables -D OUTPUT 2
A few words about this PostgreSQL setup
In a real deployment, you would want to set a password
This can be done by creating a
secret:kubectl create secret generic postgres \--from-literal=password=$(base64 /dev/urandom | head -c16)And then passing that secret to the container:
env:- name: POSTGRES_PASSWORDvalueFrom:secretKeyRef:name: postgreskey: password
Troubleshooting Portworx
If we need to see what's going on with Portworx:
PXPOD=$(kubectl -n kube-system get pod -l name=portworx -o json |jq -r .items[0].metadata.name)kubectl -n kube-system exec $PXPOD -- /opt/pwx/bin/pxctl statusWe can also connect to Lighthouse (a web UI)
check the port with
kubectl -n kube-system get svc px-lighthouseconnect to that port
the default login/password is
admin/Password1then specify
portworx-serviceas the endpoint
Removing Portworx
Portworx provides a storage driver
It needs to place itself "above" the Kubelet
(it installs itself straight on the nodes)
To remove it, we need to do more than just deleting its Kubernetes resources
It is done by applying a special label:
kubectl label nodes --all px/enabled=remove --overwriteThen removing a bunch of local files:
sudo chattr -i /etc/pwx/.private.jsonsudo rm -rf /etc/pwx /opt/pwx(on each node where Portworx was running)
Dynamic provisioning without a provider
What if we want to use Stateful sets without a storage provider?
We will have to create volumes manually
(by creating Persistent Volume objects)
These volumes will be automatically bound with matching Persistent Volume Claims
We can use local volumes (essentially bind mounts of host directories)
Of course, these volumes won't be available in case of node failure
Check this blog post for more information and gotchas
Acknowledgements
The Portworx installation tutorial, and the PostgreSQL example, were inspired by Portworx examples on Katacoda, in particular:
installing Portworx on Kubernetes
(with adapatations to use a loop device and an embedded key/value store)
persistent volumes on Kubernetes using Portworx
(with adapatations to specify a default Storage Class)
HA PostgreSQL on Kubernetes with Portworx
(with adaptations to use a Stateful Set and simplify PostgreSQL's setup)
:EN:- Using highly available persistent volumes :EN:- Example: deploying a database that can withstand node outages
:FR:- Utilisation de volumes à haute disponibilité :FR:- Exemple : déployer une base de données survivant à la défaillance d'un nœud
OpenEBS
(automatically generated title slide)
OpenEBS
OpenEBS is a popular open-source storage solution for Kubernetes
Uses the concept of "Container Attached Storage"
(1 volume = 1 dedicated controller pod + a set of replica pods)
Supports a wide range of storage engines:
LocalPV: local volumes (hostpath or device), no replication
Jiva: for lighter workloads with basic cloning/snapshotting
cStor: more powerful engine that also supports resizing, RAID, disk pools ...
Mayastor: newer, even more powerful engine with NVMe and vhost-user support k8s/openebs.md
What are all these storage engines?
LocalPV is great if we want good performance, no replication, easy setup
(it is similar to the Rancher local path provisioner)
Jiva is great if we want replication and easy setup
(data is stored in containers' filesystems)
cStor is more powerful and flexible, but requires more extensive setup
Mayastor is designed to achieve extreme performance levels
(with the right hardware and disks)
The OpenEBS documentation has a good comparison of engines to help us pick k8s/openebs.md
Installing OpenEBS with Helm
The OpenEBS control plane can be installed with Helm
It will run as a set of containers on Kubernetes worker nodes
- Install OpenEBS:helm upgrade --install openebs openebs \--repo https://openebs.github.io/charts \--namespace openebs --create-namespace
Checking what was installed
- Wait a little bit ...
Look at the pods in the
openebsnamespace:kubectl get pods --namespace openebsAnd the StorageClasses that were created:
kubectl get sc
The default StorageClasses
OpenEBS typically creates three default StorageClasses
openebs-jiva-defaultprovisions 3 replicated Jiva pods per volume- data is stored in
/openebsin the replica pods /openebsis a localpath volume mapped to/var/openebs/pvc-...on the node
- data is stored in
openebs-hostpathuses LocalPV with local directories- volumes are hostpath volumes created in
/var/openebs/localon each node
- volumes are hostpath volumes created in
openebs-deviceuses LocalPV with local block devices- requires available disks and/or a bit of extra configuration
- the default configuration filters out loop, LVM, MD devices
When do we need custom StorageClasses?
To store LocalPV hostpath volumes on a different path on the host
To change the number of replicated Jiva pods
To use a different Jiva pool
(i.e. a different path on the host to store the Jiva volumes)
To create a cStor pool
...
Defining a custom StorageClass
Example for a LocalPV hostpath class using an extra mount on /mnt/vol001:
apiVersion: storage.k8s.io/v1kind: StorageClassmetadata: name: localpv-hostpath-mntvol001 annotations: openebs.io/cas-type: local cas.openebs.io/config: | - name: BasePath value: "/mnt/vol001" - name: StorageType value: "hostpath"provisioner: openebs.io/localprovisionerneeds to be set accordingly- Storage engine is chosen by specifying the annotation
openebs.io/cas-type - Storage engine configuration is set with the annotation
cas.openebs.io/config
Checking the default hostpath StorageClass
- Let's inspect the StorageClass that OpenEBS created for us
- Let's look at the OpenEBS LocalPV hostpath StorageClass:kubectl get storageclass openebs-hostpath -o yaml
Create a host path PVC
- Let's create a Persistent Volume Claim using an explicit StorageClass
kubectl apply -f - <<EOFkind: PersistentVolumeClaimapiVersion: v1metadata: name: local-hostpath-pvcspec: storageClassName: openebs-hostpath accessModes: - ReadWriteOnce resources: requests: storage: 1GEOFMaking sure that a PV was created for our PVC
- Normally, the
openebs-hostpathStorageClass created a PV for our PVC
- Look at the PV and PVC:kubectl get pv,pvc
Create a Pod to consume the PV
Create a Pod using that PVC:
kubectl apply -f ~/container.training/k8s/openebs-pod.yamlHere are the sections that declare and use the volume:
volumes:- name: my-storagepersistentVolumeClaim:claimName: local-hostpath-pvccontainers:...volumeMounts:- mountPath: /mnt/storagename: my-storage
Verify that data is written on the node
- Let's find the file written by the Pod on the node where the Pod is running
Get the worker node where the pod is located
kubectl get pod openebs-local-hostpath-pod -ojsonpath={.spec.nodeName}SSH into the node
Check the volume content
sudo tail /var/openebs/local/pvc-*/greet.txt
Heads up!
The following labs and exercises will use the Jiva storage class
This storage class creates 3 replicas by default
It uses anti-affinity placement constraits to put these replicas on different nodes
This requires a cluster with multiple nodes!
It also requires the iSCSI client (aka initiator) to be installed on the nodes
On many platforms, the iSCSI client is preinstalled and will start automatically
If it doesn't, you might want to check this documentation page for details k8s/openebs.md
The default StorageClass
The PVC that we defined earlier specified an explicit StorageClass
We can also set a default StorageClass
It will then be used for all PVC that don't specify and explicit StorageClass
This is done with the annotation
storageclass.kubernetes.io/is-default-class
- Check if we have a default StorageClass:kubectl get storageclasses
- The default StorageClass (if there is one) is shown with
(default)
Setting a default StorageClass
- Let's set the default StorageClass to use
openebs-jiva-default
Remove the annotation (just in case we already have a default class):
kubectl annotate storageclass storageclass.kubernetes.io/is-default-class- --allAnnotate the Jiva StorageClass:
kubectl annotate storageclasses \openebs-jiva-default storageclass.kubernetes.io/is-default-class=trueCheck the result:
kuectl get storageclasses
Creating a Pod using the Jiva class
- We will create a Pod running PostgreSQL, using the default class
Create the Pod:
kubectl apply -f ~/container.training/k8s/postgres.yamlWait for the PV, PVC, and Pod to be up:
watch kubectl get pv,pvc,podWe can also check what's going on in the
openebsnamespace:watch kubectl get pods --namespace openebs
Node failover
⚠️ This will partially break your cluster!
We are going to disconnect the node running PostgreSQL from the cluster
We will see what happens, and how to recover
We will not reconnect the node to the cluster
This whole lab will take at least 10-15 minutes (due to various timeouts)
⚠️ Only do this lab at the very end, when you don't want to run anything else after!
Disconnecting the node from the cluster
Find out where the Pod is running, and SSH into that node:
kubectl get pod postgres-0 -o jsonpath={.spec.nodeName}ssh nodeXCheck the name of the network interface:
sudo ip route ls defaultThe output should look like this:
default via 10.10.0.1 dev ensX proto dhcp src 10.10.0.13 metric 100Shutdown the network interface:
sudo ip link set ensX down
Watch what's going on
- Let's look at the status of Nodes, Pods, and Events
In a first pane/tab/window, check Nodes and Pods:
watch kubectl get nodes,pods -o wideIn another pane/tab/window, check Events:
kubectl get events --watch
Node Ready → NotReady
After ~30 seconds, the control plane stops receiving heartbeats from the Node
The Node is marked NotReady
It is not schedulable anymore
(the scheduler won't place new pods there, except some special cases)
All Pods on that Node are also not ready
(they get removed from service Endpoints)
... But nothing else happens for now
(the control plane is waiting: maybe the Node will come back shortly?)
Pod eviction
After ~5 minutes, the control plane will evict most Pods from the Node
These Pods are now
TerminatingThe Pods controlled by e.g. ReplicaSets are automatically moved
(or rather: new Pods are created to replace them)
But nothing happens to the Pods controlled by StatefulSets at this point
(they remain
Terminatingforever)Why? 🤔
This is to avoid split brain scenarios
Split brain 🧠⚡️🧠
Imagine that we create a replacement pod
postgres-0on another NodeAnd 15 minutes later, the Node is reconnected and the original
postgres-0comes backWhich one is the "right" one?
What if they have conflicting data?
😱
We cannot let that happen!
Kubernetes won't do it
... Unless we tell it to
The Node is gone
One thing we can do, is tell Kubernetes "the Node won't come back"
(there are other methods; but this one is the simplest one here)
This is done with a simple
kubectl delete node
kubectl deletethe Node that we disconnected
Pod rescheduling
Kubernetes removes the Node
After a brief period of time (~1 minute) the "Terminating" Pods are removed
A replacement Pod is created on another Node
... But it doens't start yet!
Why? 🤔
Multiple attachment
By default, a disk can only be attached to one Node at a time
(sometimes it's a hardware or API limitation; sometimes enforced in software)
In our Events, we should see
FailedAttachVolumeandFailedMountmessagesAfter ~5 more minutes, the disk will be force-detached from the old Node
... Which will allow attaching it to the new Node!
🎉
The Pod will then be able to start
Failover is complete!
:EN:- Understanding Container Attached Storage (CAS) :EN:- Deploying stateful apps with OpenEBS
:FR:- Comprendre le "Container Attached Storage" (CAS) :FR:- Déployer une application "stateful" avec OpenEBS k8s/openebs.md
Centralized logging
(automatically generated title slide)
Centralized logging
Using
kubectlorsternis simple; but it has drawbacks:when a node goes down, its logs are not available anymore
we can only dump or stream logs; we want to search/index/count...
We want to send all our logs to a single place
We want to parse them (e.g. for HTTP logs) and index them
We want a nice web dashboard
We are going to deploy an EFK stack
What is EFK?
EFK is three components:
ElasticSearch (to store and index log entries)
Fluentd (to get container logs, process them, and put them in ElasticSearch)
Kibana (to view/search log entries with a nice UI)
The only component that we need to access from outside the cluster will be Kibana
Deploying EFK on our cluster
- We are going to use a YAML file describing all the required resources
- Load the YAML file into our cluster:kubectl apply -f ~/container.training/k8s/efk.yaml
If we look at the YAML file, we see that it creates a daemon set, two deployments, two services, and a few roles and role bindings (to give fluentd the required permissions).
The itinerary of a log line (before Fluentd)
A container writes a line on stdout or stderr
Both are typically piped to the container engine (Docker or otherwise)
The container engine reads the line, and sends it to a logging driver
The timestamp and stream (stdout or stderr) is added to the log line
With the default configuration for Kubernetes, the line is written to a JSON file
(
/var/log/containers/pod-name_namespace_container-id.log)That file is read when we invoke
kubectl logs; we can access it directly too
The itinerary of a log line (with Fluentd)
Fluentd runs on each node (thanks to a daemon set)
It bind-mounts
/var/log/containersfrom the host (to access these files)It continuously scans this directory for new files; reads them; parses them
Each log line becomes a JSON object, fully annotated with extra information:
container id, pod name, Kubernetes labels...These JSON objects are stored in ElasticSearch
ElasticSearch indexes the JSON objects
We can access the logs through Kibana (and perform searches, counts, etc.)
Accessing Kibana
Kibana offers a web interface that is relatively straightforward
Let's check it out!
Check which
NodePortwas allocated to Kibana:kubectl get svc kibanaWith our web browser, connect to Kibana
Using Kibana
Note: this is not a Kibana workshop! So this section is deliberately very terse.
The first time you connect to Kibana, you must "configure an index pattern"
Just use the one that is suggested,
@timestamp*Then click "Discover" (in the top-left corner)
You should see container logs
Advice: in the left column, select a few fields to display, e.g.:
kubernetes.host,kubernetes.pod_name,stream,log
*If you don't see @timestamp, it's probably because no logs exist yet.
Wait a bit, and double-check the logging pipeline!
Caveat emptor
We are using EFK because it is relatively straightforward to deploy on Kubernetes, without having to redeploy or reconfigure our cluster. But it doesn't mean that it will always be the best option for your use-case. If you are running Kubernetes in the cloud, you might consider using the cloud provider's logging infrastructure (if it can be integrated with Kubernetes).
The deployment method that we will use here has been simplified: there is only one ElasticSearch node. In a real deployment, you might use a cluster, both for performance and reliability reasons. But this is outside of the scope of this chapter.
The YAML file that we used creates all the resources in the
default namespace, for simplicity. In a real scenario, you will
create the resources in the kube-system namespace or in a dedicated namespace.
:EN:- Centralizing logs :FR:- Centraliser les logs
Collecting metrics with Prometheus
(automatically generated title slide)
Collecting metrics with Prometheus
Prometheus is an open-source monitoring system including:
multiple service discovery backends to figure out which metrics to collect
a scraper to collect these metrics
an efficient time series database to store these metrics
a specific query language (PromQL) to query these time series
an alert manager to notify us according to metrics values or trends
We are going to use it to collect and query some metrics on our Kubernetes cluster
Why Prometheus?
We don't endorse Prometheus more or less than any other system
It's relatively well integrated within the cloud-native ecosystem
It can be self-hosted (this is useful for tutorials like this)
It can be used for deployments of varying complexity:
one binary and 10 lines of configuration to get started
all the way to thousands of nodes and millions of metrics
Exposing metrics to Prometheus
Prometheus obtains metrics and their values by querying exporters
An exporter serves metrics over HTTP, in plain text
This is what the node exporter looks like:
Prometheus itself exposes its own internal metrics, too:
If you want to expose custom metrics to Prometheus:
serve a text page like these, and you're good to go
libraries are available in various languages to help with quantiles etc.
How Prometheus gets these metrics
The Prometheus server will scrape URLs like these at regular intervals
(by default: every minute; can be more/less frequent)
The list of URLs to scrape (the scrape targets) is defined in configuration
Worried about the overhead of parsing a text format?
Check this comparison of the text format with the (now deprecated) protobuf format!
Defining scrape targets
This is maybe the simplest configuration file for Prometheus:
scrape_configs: - job_name: 'prometheus' static_configs: - targets: ['localhost:9090']In this configuration, Prometheus collects its own internal metrics
A typical configuration file will have multiple
scrape_configsIn this configuration, the list of targets is fixed
A typical configuration file will use dynamic service discovery
Service discovery
This configuration file will leverage existing DNS A records:
scrape_configs: - ... - job_name: 'node' dns_sd_configs: - names: ['api-backends.dc-paris-2.enix.io'] type: 'A' port: 9100In this configuration, Prometheus resolves the provided name(s)
(here,
api-backends.dc-paris-2.enix.io)Each resulting IP address is added as a target on port 9100
Dynamic service discovery
In the DNS example, the names are re-resolved at regular intervals
As DNS records are created/updated/removed, scrape targets change as well
Existing data (previously collected metrics) is not deleted
Other service discovery backends work in a similar fashion
Other service discovery mechanisms
Prometheus can connect to e.g. a cloud API to list instances
Or to the Kubernetes API to list nodes, pods, services ...
Or a service like Consul, Zookeeper, etcd, to list applications
The resulting configurations files are way more complex
(but don't worry, we won't need to write them ourselves)
Time series database
We could wonder, "why do we need a specialized database?"
One metrics data point = metrics ID + timestamp + value
With a classic SQL or noSQL data store, that's at least 160 bits of data + indexes
Prometheus is way more efficient, without sacrificing performance
(it will even be gentler on the I/O subsystem since it needs to write less)
Would you like to know more? Check this video:
Storage in Prometheus 2.0 by Goutham V at DC17EU
Checking if Prometheus is installed
- Before trying to install Prometheus, let's check if it's already there
- Look for services with a label
app=prometheusacross all namespaces:kubectl get services --selector=app=prometheus --all-namespaces
If we see a NodePort service called prometheus-server, we're good!
(We can then skip to "Connecting to the Prometheus web UI".)
Running Prometheus on our cluster
We need to:
Run the Prometheus server in a pod
(using e.g. a Deployment to ensure that it keeps running)
Expose the Prometheus server web UI (e.g. with a NodePort)
Run the node exporter on each node (with a Daemon Set)
Set up a Service Account so that Prometheus can query the Kubernetes API
Configure the Prometheus server
(storing the configuration in a Config Map for easy updates)
Helm charts to the rescue
To make our lives easier, we are going to use a Helm chart
The Helm chart will take care of all the steps explained above
(including some extra features that we don't need, but won't hurt)
Step 1: install Helm
- If we already installed Helm earlier, this command won't break anything
- Install the Helm CLI:curl https://raw.githubusercontent.com/kubernetes/helm/master/scripts/get-helm-3 \| bash
Step 2: add the prometheus-community repo
This will add the repository containing the chart for Prometheus
This command is idempotent
(it won't break anything if the repository was already added)
- Add the repository:helm repo add prometheus-community \https://prometheus-community.github.io/helm-charts
Step 3: install Prometheus
The following command, just like the previous ones, is idempotent
(it won't error out if Prometheus is already installed)
- Install Prometheus on our cluster:helm upgrade prometheus prometheus-community/prometheus \--install \--namespace kube-system \--set server.service.type=NodePort \--set server.service.nodePort=30090 \--set server.persistentVolume.enabled=false \--set alertmanager.enabled=false
Curious about all these flags? They're explained in the next slide.
Explaining all the Helm flags
helm upgrade prometheus→ upgrade the release namedprometheus...
(a "release" is an instance of an app deployed with Helm)prometheus-community/...→ of a chart located in theprometheus-communityrepo ....../prometheus→ in that repo, get the chart namedprometheus...--install→ if the app doesn't exist, create it ...--namespace kube-system→ put it in that specific namespace ...... and set the following values when rendering the chart's templates:
server.service.type=NodePort→ expose the Prometheus server with a NodePortserver.service.nodePort=30090→ set the specific NodePort number to useserver.persistentVolume.enabled=false→ do not use a PersistentVolumeClaimalertmanager.enabled=false→ disable the alert manager entirely
Connecting to the Prometheus web UI
- Let's connect to the web UI and see what we can do
Figure out the NodePort that was allocated to the Prometheus server:
kubectl get svc --all-namespaces | grep prometheus-serverWith your browser, connect to that port
Querying some metrics
- This is easy... if you are familiar with PromQL
- Click on "Graph", and in "expression", paste the following:sum by (instance) (irate(container_cpu_usage_seconds_total{pod_name=~"worker.*"}[5m]))
Click on the blue "Execute" button and on the "Graph" tab just below
We see the cumulated CPU usage of worker pods for each node
(if we just deployed Prometheus, there won't be much data to see, though)
Getting started with PromQL
We can't learn PromQL in just 5 minutes
But we can cover the basics to get an idea of what is possible
(and have some keywords and pointers)
We are going to break down the query above
(building it one step at a time)
Graphing one metric across all tags
This query will show us CPU usage across all containers:
container_cpu_usage_seconds_totalThe suffix of the metrics name tells us:
the unit (seconds of CPU)
that it's the total used since the container creation
Since it's a "total," it is an increasing quantity
(we need to compute the derivative if we want e.g. CPU % over time)
We see that the metrics retrieved have tags attached to them
Selecting metrics with tags
This query will show us only metrics for worker containers:
container_cpu_usage_seconds_total{pod_name=~"worker.*"}The
=~operator allows regex matchingWe select all the pods with a name starting with
worker(it would be better to use labels to select pods; more on that later)
The result is a smaller set of containers
Transforming counters in rates
This query will show us CPU usage % instead of total seconds used:
100*irate(container_cpu_usage_seconds_total{pod_name=~"worker.*"}[5m])The
irateoperator computes the "per-second instant rate of increase"rateis similar but allows decreasing counters and negative valueswith
irate, if a counter goes back to zero, we don't get a negative spike
The
[5m]tells how far to look back if there is a gap in the dataAnd we multiply with
100*to get CPU % usage
Aggregation operators
This query sums the CPU usage per node:
sum by (instance) ( irate(container_cpu_usage_seconds_total{pod_name=~"worker.*"}[5m]))instancecorresponds to the node on which the container is runningsum by (instance) (...)computes the sum for each instanceNote: all the other tags are collapsed
(in other words, the resulting graph only shows the
instancetag)PromQL supports many more aggregation operators
What kind of metrics can we collect?
Node metrics (related to physical or virtual machines)
Container metrics (resource usage per container)
Databases, message queues, load balancers, ...
(check out this list of exporters!)
Instrumentation (=deluxe
printffor our code)Business metrics (customers served, revenue, ...)
Node metrics
CPU, RAM, disk usage on the whole node
Total number of processes running, and their states
Number of open files, sockets, and their states
I/O activity (disk, network), per operation or volume
Physical/hardware (when applicable): temperature, fan speed...
...and much more!
Container metrics
Similar to node metrics, but not totally identical
RAM breakdown will be different
- active vs inactive memory
- some memory is shared between containers, and specially accounted for
I/O activity is also harder to track
- async writes can cause deferred "charges"
- some page-ins are also shared between containers
For details about container metrics, see:
http://jpetazzo.github.io/2013/10/08/docker-containers-metrics/
Application metrics
Arbitrary metrics related to your application and business
System performance: request latency, error rate...
Volume information: number of rows in database, message queue size...
Business data: inventory, items sold, revenue...
Detecting scrape targets
Prometheus can leverage Kubernetes service discovery
(with proper configuration)
Services or pods can be annotated with:
prometheus.io/scrape: trueto enable scrapingprometheus.io/port: 9090to indicate the port numberprometheus.io/path: /metricsto indicate the URI (/metricsby default)
Prometheus will detect and scrape these (without needing a restart or reload)
Querying labels
What if we want to get metrics for containers belonging to a pod tagged
worker?The cAdvisor exporter does not give us Kubernetes labels
Kubernetes labels are exposed through another exporter
We can see Kubernetes labels through metrics
kube_pod_labels(each container appears as a time series with constant value of
1)Prometheus kind of supports "joins" between time series
But only if the names of the tags match exactly
Unfortunately ...
The cAdvisor exporter uses tag
pod_namefor the name of a podThe Kubernetes service endpoints exporter uses tag
podinsteadSee this blog post or this other one to see how to perform "joins"
Alas, Prometheus cannot "join" time series with different labels
(see Prometheus issue #2204 for the rationale)
There is a workaround involving relabeling, but it's "not cheap"
see this comment for an overview
or this blog post for a complete description of the process
In practice
Grafana is a beautiful (and useful) frontend to display all kinds of graphs
Not everyone needs to know Prometheus, PromQL, Grafana, etc.
But in a team, it is valuable to have at least one person who know them
That person can set up queries and dashboards for the rest of the team
It's a little bit like knowing how to optimize SQL queries, Dockerfiles...
Don't panic if you don't know these tools!
...But make sure at least one person in your team is on it 💯
:EN:- Collecting metrics with Prometheus :FR:- Collecter des métriques avec Prometheus
Prometheus and Grafana
(automatically generated title slide)
Prometheus and Grafana
What if we want metrics retention, view graphs, trends?
A very popular combo is Prometheus+Grafana:
Prometheus as the "metrics engine"
Grafana to display comprehensive dashboards
Prometheus also has an alert-manager component to trigger alerts
(we won't talk about that one)
Installing Prometheus and Grafana
A complete metrics stack needs at least:
the Prometheus server (collects metrics and stores them efficiently)
a collection of exporters (exposing metrics to Prometheus)
Grafana
a collection of Grafana dashboards (building them from scratch is tedious)
The Helm chart
kube-prometheus-stackcombines all these elements... So we're going to use it to deploy our metrics stack!
Installing kube-prometheus-stack
Let's install that stack directly from its repo
(without doing
helm repo addfirst)Otherwise, keep the same naming strategy:
helm upgrade --install kube-prometheus-stack kube-prometheus-stack \--namespace kube-prometheus-stack --create-namespace \--repo https://prometheus-community.github.io/helm-chartsThis will take a minute...
Then check what was installed:
kubectl get all --namespace kube-prometheus-stack
Exposing Grafana
Let's create an Ingress for Grafana
kubectl create ingress --namespace kube-prometheus-stack grafana \--rule=grafana.cloudnative.party/*=kube-prometheus-stack-grafana:80(as usual, make sure to use your domain name above)
Connect to Grafana
(remember that the DNS record might take a few minutes to come up)
Grafana credentials
What could the login and password be?
Let's look at the Secrets available in the namespace:
kubectl get secrets --namespace kube-prometheus-stackThere is a
kube-prometheus-stack-grafanathat looks promising!Decode the Secret:
kubectl get secret --namespace kube-prometheus-stack \kube-prometheus-stack-grafana -o json | jq '.data | map_values(@base64d)'If you don't have the
jqtool mentioned above, don't worry...
Grafana credentials
What could the login and password be?
Let's look at the Secrets available in the namespace:
kubectl get secrets --namespace kube-prometheus-stackThere is a
kube-prometheus-stack-grafanathat looks promising!Decode the Secret:
kubectl get secret --namespace kube-prometheus-stack \kube-prometheus-stack-grafana -o json | jq '.data | map_values(@base64d)'If you don't have the
jqtool mentioned above, don't worry...The login/password is hardcoded to
admin/prom-operator😬
Grafana dashboards
Once logged in, click on the "Dashboards" icon on the left
(it's the one that looks like four squares)
Then click on the "Manage" entry
Then click on "Kubernetes / Compute Resources / Cluster"
This gives us a breakdown of resource usage by Namespace
Feel free to explore the other dashboards!
:EN:- Installing Prometheus and Grafana :FR:- Installer Prometheus et Grafana
:T: Observing our cluster with Prometheus and Grafana
:Q: What's the relationship between Prometheus and Grafana? :A: Prometheus collects and graphs metrics; Grafana sends alerts :A: ✔️Prometheus collects metrics; Grafana displays them on dashboards :A: Prometheus collects and graphs metrics; Grafana is its configuration interface :A: Grafana collects and graphs metrics; Prometheus sends alerts
Resource Limits
(automatically generated title slide)
Resource Limits
We can attach resource indications to our pods
(or rather: to the containers in our pods)
We can specify limits and/or requests
We can specify quantities of CPU and/or memory
CPU vs memory
CPU is a compressible resource
(it can be preempted immediately without adverse effect)
Memory is an incompressible resource
(it needs to be swapped out to be reclaimed; and this is costly)
As a result, exceeding limits will have different consequences for CPU and memory
Exceeding CPU limits
CPU can be reclaimed instantaneously
(in fact, it is preempted hundreds of times per second, at each context switch)
If a container uses too much CPU, it can be throttled
(it will be scheduled less often)
The processes in that container will run slower
(or rather: they will not run faster)
CPU limits implementation details
A container with a CPU limit will be "rationed" by the kernel
Every
cfs_period_us, it will receive a CPU quota, like an "allowance"(that interval defaults to 100ms)
Once it has used its quota, it will be stalled until the next period
This can easily result in throttling for bursty workloads
(see details on next slide)
A bursty example
Web service receives one request per minute
Each request takes 1 second of CPU
Average load: 1.66%
Let's say we set a CPU limit of 10%
This means CPU quotas of 10ms every 100ms
Obtaining the quota for 1 second of CPU will take 10 seconds
Observed latency will be 10 seconds (... actually 9.9s) instead of 1 second
(real-life scenarios will of course be less extreme, but they do happen!)
Multi-core scheduling details
Each core gets a small share of the container's CPU quota
(this avoids locking and contention on the "global" quota for the container)
By default, the kernel distributes that quota to CPUs in 5ms increments
(tunable with
kernel.sched_cfs_bandwidth_slice_us)If a containerized process (or thread) uses up its local CPU quota:
it gets more from the "global" container quota (if there's some left)
If it "yields" (e.g. sleeps for I/O) before using its local CPU quota:
the quota is soon returned to the "global" container quota, minus 1ms
Low quotas on machines with many cores
The local CPU quota is not immediately returned to the global quota
this reduces locking and contention on the global quota
but this can cause starvation when many threads/processes become runnable
That 1ms that "stays" on the local CPU quota is often useful
if the thread/process becomes runnable, it can be scheduled immediately
again, this reduces locking and contention on the global quota
but if the thread/process doesn't become runnable, it is wasted!
this can become a huge problem on machines with many cores
CPU limits in a nutshell
Beware if you run small bursty workloads on machines with many cores!
("highly-threaded, user-interactive, non-cpu bound applications")
Check the
nr_throttledandthrottled_timemetrics incpu.statPossible solutions/workarounds:
be generous with the limits
make sure your kernel has the appropriate patch
For more details, check this blog post or these ones (part 1, part 2).
Exceeding memory limits
Memory needs to be swapped out before being reclaimed
"Swapping" means writing memory pages to disk, which is very slow
On a classic system, a process that swaps can get 1000x slower
(because disk I/O is 1000x slower than memory I/O)
Exceeding the memory limit (even by a small amount) can reduce performance a lot
Kubernetes does not support swap (more on that later!)
Exceeding the memory limit will cause the container to be killed
Limits vs requests
Limits are "hard limits" (they can't be exceeded)
a container exceeding its memory limit is killed
a container exceeding its CPU limit is throttled
Requests are used for scheduling purposes
a container using less than what it requested will never be killed or throttled
the scheduler uses the requested sizes to determine placement
the resources requested by all pods on a node will never exceed the node size
Pod quality of service
Each pod is assigned a QoS class (visible in status.qosClass).
If limits = requests:
as long as the container uses less than the limit, it won't be affected
if all containers in a pod have (limits=requests), QoS is considered "Guaranteed"
If requests < limits:
as long as the container uses less than the request, it won't be affected
otherwise, it might be killed/evicted if the node gets overloaded
if at least one container has (requests<limits), QoS is considered "Burstable"
If a pod doesn't have any request nor limit, QoS is considered "BestEffort"
Quality of service impact
When a node is overloaded, BestEffort pods are killed first
Then, Burstable pods that exceed their requests
Burstable and Guaranteed pods below their requests are never killed
(except if their node fails)
If we only use Guaranteed pods, no pod should ever be killed
(as long as they stay within their limits)
(Pod QoS is also explained in this page of the Kubernetes documentation and in this blog post.)
Where is my swap?
The semantics of memory and swap limits on Linux cgroups are complex
With cgroups v1, it's not possible to disable swap for a cgroup
(the closest option is to reduce "swappiness")
It is possible with cgroups v2 (see the kernel docs and the fbatx docs)
Cgroups v2 aren't widely deployed yet
The architects of Kubernetes wanted to ensure that Guaranteed pods never swap
The simplest solution was to disable swap entirely
Alternative point of view
Swap enables paging¹ of anonymous² memory
Even when swap is disabled, Linux will still page memory for:
executables, libraries
mapped files
Disabling swap will reduce performance and available resources
For a good time, read kubernetes/kubernetes#53533
Also read this excellent blog post about swap
¹Paging: reading/writing memory pages from/to disk to reclaim physical memory
²Anonymous memory: memory that is not backed by files or blocks
Enabling swap anyway
If you don't care that pods are swapping, you can enable swap
You will need to add the flag
--fail-swap-on=falseto kubelet(otherwise, it won't start!)
Specifying resources
Resource requests are expressed at the container level
CPU is expressed in "virtual CPUs"
(corresponding to the virtual CPUs offered by some cloud providers)
CPU can be expressed with a decimal value, or even a "milli" suffix
(so 100m = 0.1)
Memory is expressed in bytes
Memory can be expressed with k, M, G, T, ki, Mi, Gi, Ti suffixes
(corresponding to 10^3, 10^6, 10^9, 10^12, 2^10, 2^20, 2^30, 2^40)
Specifying resources in practice
This is what the spec of a Pod with resources will look like:
containers:- name: httpenv image: jpetazzo/httpenv resources: limits: memory: "100Mi" cpu: "100m" requests: memory: "100Mi" cpu: "10m"This set of resources makes sure that this service won't be killed (as long as it stays below 100 MB of RAM), but allows its CPU usage to be throttled if necessary.
Default values
If we specify a limit without a request:
the request is set to the limit
If we specify a request without a limit:
there will be no limit
(which means that the limit will be the size of the node)
If we don't specify anything:
the request is zero and the limit is the size of the node
Unless there are default values defined for our namespace!
We need default resource values
If we do not set resource values at all:
the limit is "the size of the node"
the request is zero
This is generally not what we want
a container without a limit can use up all the resources of a node
if the request is zero, the scheduler can't make a smart placement decision
To address this, we can set default values for resources
This is done with a LimitRange object
Defining min, max, and default resources
(automatically generated title slide)
Defining min, max, and default resources
We can create LimitRange objects to indicate any combination of:
min and/or max resources allowed per pod
default resource limits
default resource requests
maximal burst ratio (limit/request)
LimitRange objects are namespaced
They apply to their namespace only
LimitRange example
apiVersion: v1kind: LimitRangemetadata: name: my-very-detailed-limitrangespec: limits: - type: Container min: cpu: "100m" max: cpu: "2000m" memory: "1Gi" default: cpu: "500m" memory: "250Mi" defaultRequest: cpu: "500m"Example explanation
The YAML on the previous slide shows an example LimitRange object specifying very detailed limits on CPU usage, and providing defaults on RAM usage.
Note the type: Container line: in the future,
it might also be possible to specify limits
per Pod, but it's not officially documented yet.
LimitRange details
LimitRange restrictions are enforced only when a Pod is created
(they don't apply retroactively)
They don't prevent creation of e.g. an invalid Deployment or DaemonSet
(but the pods will not be created as long as the LimitRange is in effect)
If there are multiple LimitRange restrictions, they all apply together
(which means that it's possible to specify conflicting LimitRanges,
preventing any Pod from being created)If a LimitRange specifies a
maxfor a resource but nodefault,
thatmaxvalue becomes thedefaultlimit too
Namespace quotas
(automatically generated title slide)
Namespace quotas
We can also set quotas per namespace
Quotas apply to the total usage in a namespace
(e.g. total CPU limits of all pods in a given namespace)
Quotas can apply to resource limits and/or requests
(like the CPU and memory limits that we saw earlier)
Quotas can also apply to other resources:
"extended" resources (like GPUs)
storage size
number of objects (number of pods, services...)
Creating a quota for a namespace
Quotas are enforced by creating a ResourceQuota object
ResourceQuota objects are namespaced, and apply to their namespace only
We can have multiple ResourceQuota objects in the same namespace
The most restrictive values are used
Limiting total CPU/memory usage
- The following YAML specifies an upper bound for limits and requests:apiVersion: v1kind: ResourceQuotametadata:name: a-little-bit-of-computespec:hard:requests.cpu: "10"requests.memory: 10Gilimits.cpu: "20"limits.memory: 20Gi
These quotas will apply to the namespace where the ResourceQuota is created.
Limiting number of objects
- The following YAML specifies how many objects of specific types can be created:apiVersion: v1kind: ResourceQuotametadata:name: quota-for-objectsspec:hard:pods: 100services: 10secrets: 10configmaps: 10persistentvolumeclaims: 20services.nodeports: 0services.loadbalancers: 0count/roles.rbac.authorization.k8s.io: 10
(The count/ syntax allows limiting arbitrary objects, including CRDs.)
YAML vs CLI
Quotas can be created with a YAML definition
...Or with the
kubectl create quotacommandExample:
kubectl create quota my-resource-quota --hard=pods=300,limits.memory=300GiWith both YAML and CLI form, the values are always under the
hardsection(there is no
softquota)
Viewing current usage
When a ResourceQuota is created, we can see how much of it is used:
kubectl describe resourcequota my-resource-quotaName: my-resource-quotaNamespace: defaultResource Used Hard-------- ---- ----pods 12 100services 1 5services.loadbalancers 0 0services.nodeports 0 0Advanced quotas and PriorityClass
Since Kubernetes 1.12, it is possible to create PriorityClass objects
Pods can be assigned a PriorityClass
Quotas can be linked to a PriorityClass
This allows us to reserve resources for pods within a namespace
For more details, check this documentation page
Limiting resources in practice
(automatically generated title slide)
Limiting resources in practice
We have at least three mechanisms:
requests and limits per Pod
LimitRange per namespace
ResourceQuota per namespace
Let's see a simple recommendation to get started with resource limits
Set a LimitRange
In each namespace, create a LimitRange object
Set a small default CPU request and CPU limit
(e.g. "100m")
Set a default memory request and limit depending on your most common workload
for Java, Ruby: start with "1G"
for Go, Python, PHP, Node: start with "250M"
Set upper bounds slightly below your expected node size
(80-90% of your node size, with at least a 500M memory buffer)
Set a ResourceQuota
In each namespace, create a ResourceQuota object
Set generous CPU and memory limits
(e.g. half the cluster size if the cluster hosts multiple apps)
Set generous objects limits
these limits should not be here to constrain your users
they should catch a runaway process creating many resources
example: a custom controller creating many pods
Observe, refine, iterate
Observe the resource usage of your pods
(we will see how in the next chapter)
Adjust individual pod limits
If you see trends: adjust the LimitRange
(rather than adjusting every individual set of pod limits)
Observe the resource usage of your namespaces
(with
kubectl describe resourcequota ...)Rinse and repeat regularly
Viewing a namespace limits and quotas
kubectl describe namespacewill display resource limits and quotas
Try it out:
kubectl describe namespace defaultView limits and quotas for all namespaces:
kubectl describe namespace
Additional resources
A Practical Guide to Setting Kubernetes Requests and Limits
explains what requests and limits are
provides guidelines to set requests and limits
gives PromQL expressions to compute good values
(our app needs to be running for a while)
-
generates web reports on resource usage
:EN:- Setting compute resource limits :EN:- Defining default policies for resource usage :EN:- Managing cluster allocation and quotas :EN:- Resource management in practice
:FR:- Allouer et limiter les ressources des conteneurs :FR:- Définir des ressources par défaut :FR:- Gérer les quotas de ressources au niveau du cluster :FR:- Conseils pratiques
Checking Node and Pod resource usage
(automatically generated title slide)
Checking Node and Pod resource usage
We've installed a few things on our cluster so far
How much resources (CPU, RAM) are we using?
We need metrics!
- Let's try the following command:kubectl top nodes
Is metrics-server installed?
If we see a list of nodes, with CPU and RAM usage:
great, metrics-server is installed!
If we see
error: Metrics API not available:metrics-server isn't installed, so we'll install it!
The resource metrics pipeline
The
kubectl topcommand relies on the Metrics APIThe Metrics API is part of the "resource metrics pipeline"
The Metrics API isn't served (built into) the Kubernetes API server
It is made available through the aggregation layer
It is usually served by a component called metrics-server
It is optional (Kubernetes can function without it)
It is necessary for some features (like the Horizontal Pod Autoscaler) k8s/metrics-server.md
Other ways to get metrics
We could use a SAAS like Datadog, New Relic...
We could use a self-hosted solution like Prometheus
Or we could use metrics-server
What's special about metrics-server?
Pros/cons
Cons:
no data retention (no history data, just instant numbers)
only CPU and RAM of nodes and pods (no disk or network usage or I/O...)
Pros:
very lightweight
doesn't require storage
used by Kubernetes autoscaling
Why metrics-server
We may install something fancier later
(think: Prometheus with Grafana)
But metrics-server will work in minutes
It will barely use resources on our cluster
It's required for autoscaling anyway
How metric-server works
It runs a single Pod
That Pod will fetch metrics from all our Nodes
It will expose them through the Kubernetes API agregation layer
(we won't say much more about that agregation layer; that's fairly advanced stuff!)
Installing metrics-server
In a lot of places, this is done with a little bit of custom YAML
(derived from the official installation instructions)
We're going to use Helm one more time:
helm upgrade --install metrics-server bitnami/metrics-server \--create-namespace --namespace metrics-server \--set apiService.create=true \--set extraArgs.kubelet-insecure-tls=true \--set extraArgs.kubelet-preferred-address-types=InternalIPWhat are these options for?
Installation options
apiService.create=trueregister
metrics-serverwith the Kubernetes agregation layer(create an entry that will show up in
kubectl get apiservices)extraArgs.kubelet-insecure-tls=truewhen connecting to nodes to collect their metrics, don't check kubelet TLS certs
(because most kubelet certs include the node name, but not its IP address)
extraArgs.kubelet-preferred-address-types=InternalIPwhen connecting to nodes, use their internal IP address instead of node name
(because the latter requires an internal DNS, which is rarely configured)
Testing metrics-server
After a minute or two, metrics-server should be up
We should now be able to check Nodes resource usage:
kubectl top nodesAnd Pods resource usage, too:
kubectl top pods --all-namespaces
Keep some padding
The RAM usage that we see should correspond more or less to the Resident Set Size
Our pods also need some extra space for buffers, caches...
Do not aim for 100% memory usage!
Some more realistic targets:
50% (for workloads with disk I/O and leveraging caching)
90% (on very big nodes with mostly CPU-bound workloads)
75% (anywhere in between!)
Other tools
kube-capacity is a great CLI tool to view resources
It can show resource and limits, and compare them with usage
It can show utilization per node, or per pod
kube-resource-report can generate HTML reports
:EN:- The resource metrics pipeline :EN:- Installing metrics-server
:EN:- Le resource metrics pipeline :FR:- Installtion de metrics-server
Cluster sizing
(automatically generated title slide)
Cluster sizing
What happens when the cluster gets full?
How can we scale up the cluster?
Can we do it automatically?
What are other methods to address capacity planning?
When are we out of resources?
kubelet monitors node resources:
memory
node disk usage (typically the root filesystem of the node)
image disk usage (where container images and RW layers are stored)
For each resource, we can provide two thresholds:
a hard threshold (if it's met, it provokes immediate action)
a soft threshold (provokes action only after a grace period)
Resource thresholds and grace periods are configurable
(by passing kubelet command-line flags)
What happens then?
If disk usage is too high:
kubelet will try to remove terminated pods
then, it will try to evict pods
If memory usage is too high:
- it will try to evict pods
The node is marked as "under pressure"
This temporarily prevents new pods from being scheduled on the node
Which pods get evicted?
kubelet looks at the pods' QoS and PriorityClass
First, pods with BestEffort QoS are considered
Then, pods with Burstable QoS exceeding their requests
(but only if the exceeding resource is the one that is low on the node)
Finally, pods with Guaranteed QoS, and Burstable pods within their requests
Within each group, pods are sorted by PriorityClass
If there are pods with the same PriorityClass, they are sorted by usage excess
(i.e. the pods whose usage exceeds their requests the most are evicted first)
Eviction of Guaranteed pods
Normally, pods with Guaranteed QoS should not be evicted
A chunk of resources is reserved for node processes (like kubelet)
It is expected that these processes won't use more than this reservation
If they do use more resources anyway, all bets are off!
If this happens, kubelet must evict Guaranteed pods to preserve node stability
(or Burstable pods that are still within their requested usage)
What happens to evicted pods?
The pod is terminated
It is marked as
Failedat the API levelIf the pod was created by a controller, the controller will recreate it
The pod will be recreated on another node, if there are resources available!
For more details about the eviction process, see:
this documentation page about resource pressure and pod eviction,
this other documentation page about pod priority and preemption.
What if there are no resources available?
Sometimes, a pod cannot be scheduled anywhere:
all the nodes are under pressure,
or the pod requests more resources than are available
The pod then remains in
Pendingstate until the situation improves
Cluster scaling
One way to improve the situation is to add new nodes
This can be done automatically with the Cluster Autoscaler
The autoscaler will automatically scale up:
- if there are pods that failed to be scheduled
The autoscaler will automatically scale down:
- if nodes have a low utilization for an extended period of time
Restrictions, gotchas ...
The Cluster Autoscaler only supports a few cloud infrastructures
(see here for a list)
The Cluster Autoscaler cannot scale down nodes that have pods using:
local storage
affinity/anti-affinity rules preventing them from being rescheduled
a restrictive PodDisruptionBudget
Other way to do capacity planning
"Running Kubernetes without nodes"
Systems like Virtual Kubelet or Kiyot can run pods using on-demand resources
Virtual Kubelet can leverage e.g. ACI or Fargate to run pods
Kiyot runs pods in ad-hoc EC2 instances (1 instance per pod)
Economic advantage (no wasted capacity)
Security advantage (stronger isolation between pods)
Check this blog post for more details.
:EN:- What happens when the cluster is at, or over, capacity :EN:- Cluster sizing and scaling
:FR:- Ce qui se passe quand il n'y a plus assez de ressources :FR:- Dimensionner et redimensionner ses clusters
The Horizontal Pod Autoscaler
(automatically generated title slide)
The Horizontal Pod Autoscaler
What is the Horizontal Pod Autoscaler, or HPA?
It is a controller that can perform horizontal scaling automatically
Horizontal scaling = changing the number of replicas
(adding/removing pods)
Vertical scaling = changing the size of individual replicas
(increasing/reducing CPU and RAM per pod)
Cluster scaling = changing the size of the cluster
(adding/removing nodes)
k8s/horizontal-pod-autoscaler.md
Principle of operation
Each HPA resource (or "policy") specifies:
which object to monitor and scale (e.g. a Deployment, ReplicaSet...)
min/max scaling ranges (the max is a safety limit!)
a target resource usage (e.g. the default is CPU=80%)
The HPA continuously monitors the CPU usage for the related object
It computes how many pods should be running:
TargetNumOfPods = ceil(sum(CurrentPodsCPUUtilization) / Target)It scales the related object up/down to this target number of pods
k8s/horizontal-pod-autoscaler.md
Pre-requirements
The metrics server needs to be running
(i.e. we need to be able to see pod metrics with
kubectl top pods)The pods that we want to autoscale need to have resource requests
(because the target CPU% is not absolute, but relative to the request)
The latter actually makes a lot of sense:
if a Pod doesn't have a CPU request, it might be using 10% of CPU...
...but only because there is no CPU time available!
this makes sure that we won't add pods to nodes that are already resource-starved
k8s/horizontal-pod-autoscaler.md
Testing the HPA
We will start a CPU-intensive web service
We will send some traffic to that service
We will create an HPA policy
The HPA will automatically scale up the service for us
k8s/horizontal-pod-autoscaler.md
A CPU-intensive web service
Let's use
jpetazzo/busyhttp(it is a web server that will use 1s of CPU for each HTTP request)
Deploy the web server:
kubectl create deployment busyhttp --image=jpetazzo/busyhttpExpose it with a ClusterIP service:
kubectl expose deployment busyhttp --port=80Get the ClusterIP allocated to the service:
kubectl get svc busyhttp
k8s/horizontal-pod-autoscaler.md
Monitor what's going on
- Let's start a bunch of commands to watch what is happening
- Monitor pod CPU usage:watch kubectl top pods -l app=busyhttp
- Monitor service latency:httping http://$CLUSTERIP/
- Monitor cluster events:kubectl get events -w
k8s/horizontal-pod-autoscaler.md
Send traffic to the service
- We will use
ab(Apache Bench) to send traffic
- Send a lot of requests to the service, with a concurrency level of 3:ab -c 3 -n 100000 http://$CLUSTERIP/
The latency (reported by httping) should increase above 3s.
The CPU utilization should increase to 100%.
(The server is single-threaded and won't go above 100%.)
k8s/horizontal-pod-autoscaler.md
Create an HPA policy
- There is a helper command to do that for us:
kubectl autoscale
- Create the HPA policy for the
busyhttpdeployment:kubectl autoscale deployment busyhttp --max=10
By default, it will assume a target of 80% CPU usage.
This can also be set with --cpu-percent=.
Create an HPA policy
- There is a helper command to do that for us:
kubectl autoscale
- Create the HPA policy for the
busyhttpdeployment:kubectl autoscale deployment busyhttp --max=10
By default, it will assume a target of 80% CPU usage.
This can also be set with --cpu-percent=.
The autoscaler doesn't seem to work. Why?
k8s/horizontal-pod-autoscaler.md
What did we miss?
The events stream gives us a hint, but to be honest, it's not very clear:
missing request for cpuWe forgot to specify a resource request for our Deployment!
The HPA target is not an absolute CPU%
It is relative to the CPU requested by the pod
k8s/horizontal-pod-autoscaler.md
Adding a CPU request
Let's edit the deployment and add a CPU request
Since our server can use up to 1 core, let's request 1 core
- Edit the Deployment definition:kubectl edit deployment busyhttp
- In the
containerslist, add the following block:resources:requests:cpu: "1"
k8s/horizontal-pod-autoscaler.md
Results
After saving and quitting, a rolling update happens
(if
aborhttpingexits, make sure to restart it)It will take a minute or two for the HPA to kick in:
the HPA runs every 30 seconds by default
it needs to gather metrics from the metrics server first
If we scale further up (or down), the HPA will react after a few minutes:
it won't scale up if it already scaled in the last 3 minutes
it won't scale down if it already scaled in the last 5 minutes
k8s/horizontal-pod-autoscaler.md
What about other metrics?
The HPA in API group
autoscaling/v1only supports CPU scalingThe HPA in API group
autoscaling/v2beta2supports metrics from various API groups:metrics.k8s.io, aka metrics server (per-Pod CPU and RAM)
custom.metrics.k8s.io, custom metrics per Pod
external.metrics.k8s.io, external metrics (not associated to Pods)
Kubernetes doesn't implement any of these API groups
Using these metrics requires registering additional APIs
The metrics provided by metrics server are standard; everything else is custom
For more details, see this great blog post or this talk
k8s/horizontal-pod-autoscaler.md
Cleanup
- Since
busyhttpuses CPU cycles, let's stop it before moving on
- Delete the
busyhttpDeployment:kubectl delete deployment busyhttp
:EN:- Auto-scaling resources :FR:- Auto-scaling (dimensionnement automatique) des ressources
Scaling with custom metrics
(automatically generated title slide)
Scaling with custom metrics
The HorizontalPodAutoscaler v1 can only scale on Pod CPU usage
Sometimes, we need to scale using other metrics:
memory
requests per second
latency
active sessions
items in a work queue
...
The HorizontalPodAutoscaler v2 can do it!
Requirements
⚠️ Autoscaling on custom metrics is fairly complex!
We need some metrics system
(Prometheus is a popular option, but others are possible too)
We need our metrics (latency, traffic...) to be fed in the system
(with Prometheus, this might require a custom exporter)
We need to expose these metrics to Kubernetes
(Kubernetes doesn't "speak" the Prometheus API)
Then we can set up autoscaling!
The plan
We will deploy the DockerCoins demo app
(one of its components has a bottleneck; its latency will increase under load)
We will use Prometheus to collect and store metrics
We will deploy a tiny HTTP latency monitor (a Prometheus exporter)
We will deploy the "Prometheus adapter"
(mapping Prometheus metrics to Kubernetes-compatible metrics)
We will create an HorizontalPodAutoscaler 🎉
Deploying DockerCoins
- That's the easy part!
Create a new namespace and switch to it:
kubectl create namespace customscalingkns customscalingDeploy DockerCoins, and scale up the
workerDeployment:kubectl apply -f ~/container.training/k8s/dockercoins.yamlkubectl scale deployment worker --replicas=10
Current state of affairs
The
rngservice is a bottleneck(it cannot handle more than 10 requests/second)
With enough traffic, its latency increases
(by about 100ms per
workerPod after the 3rd worker)
Check the
webuiport and open it in your browser:kubectl get service webuiCheck the
rngClusterIP and test it with e.g.httping:kubectl get service rng
Measuring latency
We will use a tiny custom Prometheus exporter, httplat
httplatexposes Prometheus metrics on port 9080 (by default)It monitors exactly one URL, that must be passed as a command-line argument
Deploy
httplat:kubectl create deployment httplat --image=jpetazzo/httplat -- httplat http://rng/Expose it:
kubectl expose deployment httplat --port=9080
Measuring latency in the real world
We are using this tiny custom exporter for simplicity
A more common method to collect latency is to use a service mesh
A service mesh can usually collect latency for all services automatically
Install Prometheus
We will use the Prometheus community Helm chart
(because we can configure it dynamically with annotations)
- If it's not installed yet on the cluster, install Prometheus:helm repo add prometheus-communityhttps://prometheus-community.github.io/helm-chartshelm upgrade prometheus prometheus-community/prometheus \--install \--namespace kube-system \--set server.service.type=NodePort \--set server.service.nodePort=30090 \--set server.persistentVolume.enabled=false \--set alertmanager.enabled=false
Configure Prometheus
- We can use annotations to tell Prometheus to collect the metrics
- Tell Prometheus to "scrape" our latency exporter:kubectl annotate service httplat \prometheus.io/scrape=true \prometheus.io/port=9080 \prometheus.io/path=/metrics
If you deployed Prometheus differently, you might have to configure it manually.
You'll need to instruct it to scrape http://httplat.customscaling.svc:9080/metrics.
Make sure that metrics get collected
- Before moving on, confirm that Prometheus has our metrics
Connect to Prometheus
(if you installed it like instructed above, it is exposed as a NodePort on port 30090)
Check that
httplatmetrics are availableYou can try to graph the following PromQL expression:
rate(httplat_latency_seconds_sum[2m])/rate(httplat_latency_seconds_count[2m])
Troubleshooting
Make sure that the exporter works:
get the ClusterIP of the exporter with
kubectl get svc httplatcurl http://<ClusterIP>:9080/metricscheck that the result includes the
httplathistogram
Make sure that Prometheus is scraping the exporter:
go to
Status/Targetsin Prometheusmake sure that
httplatshows up in there
Creating the autoscaling policy
We need custom YAML (we can't use the
kubectl autoscalecommand)It must specify
scaleTargetRef, the resource to scaleany resource with a
scalesub-resource will dothis includes Deployment, ReplicaSet, StatefulSet...
It must specify one or more
metricsto look atif multiple metrics are given, the autoscaler will "do the math" for each one
it will then keep the largest result
Details about the metrics list
- Each item will look like this:- type: <TYPE-OF-METRIC><TYPE-OF-METRIC>:metric:name: <NAME-OF-METRIC><...optional selector (mandatory for External metrics)...>target:type: <TYPE-OF-TARGET><TYPE-OF-TARGET>: <VALUE><describedObject field, for Object metrics>
<TYPE-OF-METRIC> can be Resource, Pods, Object, or External.
<TYPE-OF-TARGET> can be Utilization, Value, or AverageValue.
Let's explain the 4 different <TYPE-OF-METRIC> values!
Resource
Use "classic" metrics served by metrics-server (cpu and memory).
- type: Resource resource: name: cpu target: type: Utilization averageUtilization: 50Compute average utilization (usage/requests) across pods.
It's also possible to specify Value or AverageValue instead of Utilization.
(To scale according to "raw" CPU or memory usage.)
Pods
Use custom metrics. These are still "per-Pod" metrics.
- type: Pods pods: metric: name: packets-per-second target: type: AverageValue averageValue: 1ktype: must be AverageValue.
(It cannot be Utilization, since these can't be used in Pod requests.)
Object
Use custom metrics. These metrics are "linked" to any arbitrary resource.
(E.g. a Deployment, Service, Ingress, ...)
- type: Object object: metric: name: requests-per-second describedObject: apiVersion: networking.k8s.io/v1 kind: Ingress name: main-route target: type: AverageValue value: 100type: can be Value or AverageValue (see next slide for details).
Value vs AverageValue
Valueuse the value as-is
useful to pace a client or producer
"target a specific total load on a specific endpoint or queue"
AverageValuedivide the value by the number of pods
useful to scale a server or consumer
"scale our systems to meet a given SLA/SLO"
External
Use arbitrary metrics. The series to use is specified with a label selector.
- type: External external: metric: name: queue_messages_ready selector: "queue=worker_tasks" target: type: AverageValue averageValue: 30The selector will be passed along when querying the metrics API.
Its meaninng is implementation-dependent.
It may or may not correspond to Kubernetes labels.
One more thing ...
We can give a
behaviorset of optionsIndicates:
how much to scale up/down in a single step
a stabilization window to avoid hysteresis effects
The default stabilization window is 15 seconds for
scaleUp(we might want to change that!)
Putting togeher k8s/hpa-v2-pa-httplat.yaml:
kind: HorizontalPodAutoscalerapiVersion: autoscaling/v2beta2metadata: name: rngspec: scaleTargetRef: apiVersion: apps/v1 kind: Deployment name: rng minReplicas: 1 maxReplicas: 20 behavior: scaleUp: stabilizationWindowSeconds: 60 scaleDown: stabilizationWindowSeconds: 180 metrics: - type: Object object: describedObject: apiVersion: v1 kind: Service name: httplat metric: name: httplat_latency_seconds target: type: Value value: 0.1Creating the autoscaling policy
We will register the policy
Of course, it won't quite work yet (we're missing the Prometheus adapter)
Create the HorizontalPodAutoscaler:
kubectl apply -f ~/container.training/k8s/hpa-v2-pa-httplat.yamlCheck the logs of the
controller-manager:stern --namespace=kube-system --tail=10 controller-manager
After a little while we should see messages like this:
no custom metrics API (custom.metrics.k8s.io) registeredcustom.metrics.k8s.io
The HorizontalPodAutoscaler will get the metrics from the Kubernetes API itself
In our specific case, it will access a resource like this one:
/apis/custom.metrics.k8s.io/v1beta1/namespaces/customscaling/services/httplat/httplat_latency_secondsBy default, the Kubernetes API server doesn't implement
custom.metrics.k8s.io(we can have a look at
kubectl get apiservices)We need to:
start an API service implementing this API group
register it with our API server
The Prometheus adapter
The Prometheus adapter is an open source project:
It's a Kubernetes API service implementing API group
custom.metrics.k8s.ioIt maps the requests it receives to Prometheus metrics
Exactly what we need!
Deploying the Prometheus adapter
- There is
an appa Helm chart for that
- Install the Prometheus adapter:helm upgrade prometheus-adapter prometheus-community/prometheus-adapter \--install --namespace=kube-system \--set prometheus.url=http://prometheus-server.kube-system.svc \--set prometheus.port=80
It comes with some default mappings
But we will need to add
httplatto these mappings
Configuring the Prometheus adapter
The Prometheus adapter can be configured/customized through a ConfigMap
We are going to edit that ConfigMap, then restart the adapter
We need to add a rule that will say:
all the metrics series named
httplat_latency_seconds_sum...... belong to Services ...
... the name of the Service and its Namespace are indicated by the
kubernetes_nameandkubernetes_namespacePrometheus tags respectively ...... and the exact value to use should be the following PromQL expression
The mapping rule
Here is the rule that we need to add to the configuration:
- seriesQuery: | httplat_latency_seconds_sum{kubernetes_namespace!="",kubernetes_name!=""} resources: overrides: kubernetes_namespace: resource: namespace kubernetes_name: resource: service name: matches: "httplat_latency_seconds_sum" as: "httplat_latency_seconds" metricsQuery: | rate(httplat_latency_seconds_sum{<<.LabelMatchers>>}[2m]) /rate(httplat_latency_seconds_count{<<.LabelMatchers>>}[2m])(I built it following the walkthrough in the Prometheus adapter documentation.)
Editing the adapter's configuration
Edit the adapter's ConfigMap:
kubectl edit configmap prometheus-adapter --namespace=kube-systemAdd the new rule in the
rulessection, at the end of the configuration fileSave, quit
Restart the Prometheus adapter:
kubectl rollout restart deployment --namespace=kube-system prometheus-adapter
Witness the marvel of custom autoscaling
(Sort of)
After a short while, the
rngDeployment will scale upIt should scale up until the latency drops below 100ms
(and continue to scale up a little bit more after that)
Then, since the latency will be well below 100ms, it will scale down
... and back up again, etc.
(See pictures on next slides!)
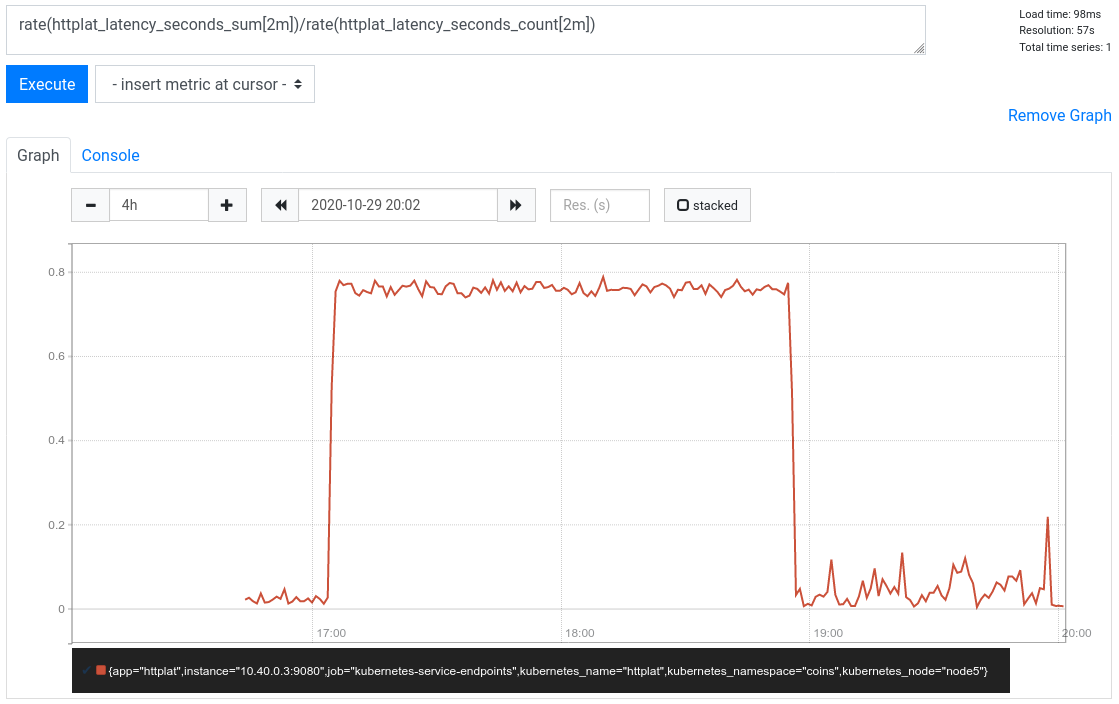
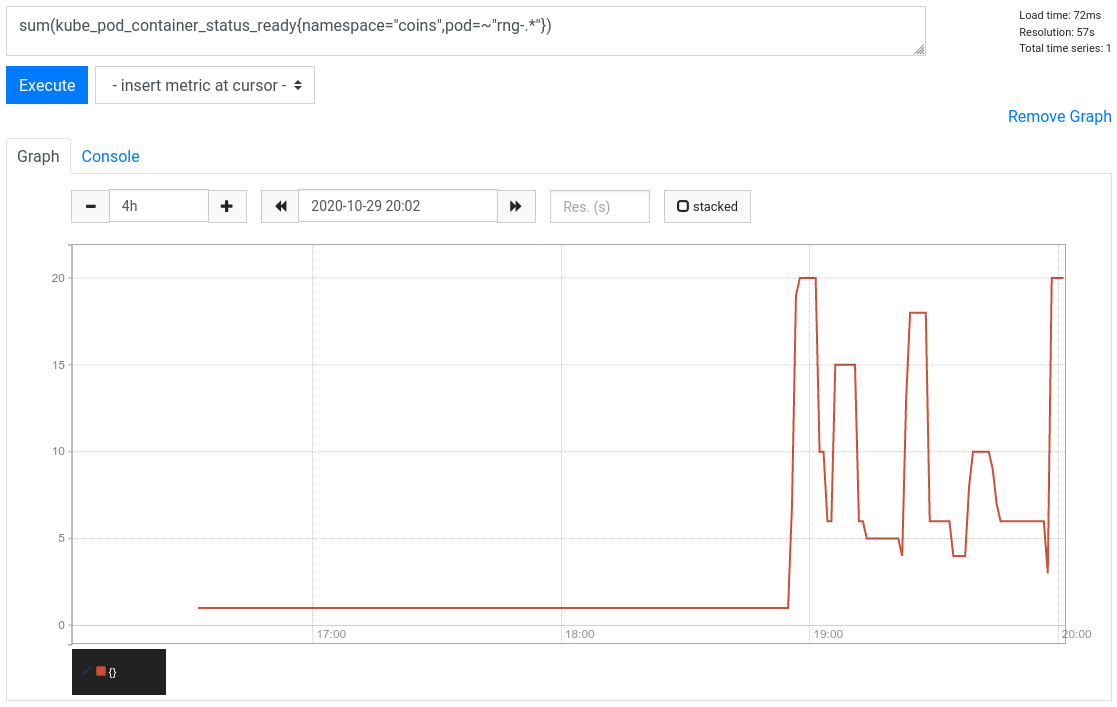
What's going on?
The autoscaler's information is slightly out of date
(not by much; probably between 1 and 2 minute)
It's enough to cause the oscillations to happen
One possible fix is to tell the autoscaler to wait a bit after each action
It will reduce oscillations, but will also slow down its reaction time
(and therefore, how fast it reacts to a peak of traffic)
What's going on? Take 2
As soon as the measured latency is significantly below our target (100ms) ...
the autoscaler tries to scale down
If the latency is measured at 20ms ...
the autoscaler will try to divide the number of pods by five!
One possible solution: apply a formula to the measured latency, so that values between e.g. 10 and 100ms get very close to 100ms.
Another solution: instead of targetting for a specific latency, target a 95th percentile latency or something similar, using a more advanced PromQL expression (and leveraging the fact that we have histograms instead of raw values).
Troubleshooting
Check that the adapter registered itself correctly:
kubectl get apiservices | grep metricsCheck that the adapter correctly serves metrics:
kubectl get --raw /apis/custom.metrics.k8s.io/v1beta1Check that our httplat metrics are available:
kubectl get --raw /apis/custom.metrics.k8s.io/v1beta1\/namespaces/customscaling/services/httplat/httplat_latency_secondsAlso check the logs of the prometheus-adapter and the kube-controller-manager.
:EN:- Autoscaling with custom metrics :FR:- Suivi de charge avancé (HPAv2)
Extending the Kubernetes API
(automatically generated title slide)
Extending the Kubernetes API
There are multiple ways to extend the Kubernetes API.
We are going to cover:
Controllers
Dynamic Admission Webhooks
Custom Resource Definitions (CRDs)
The Aggregation Layer
But first, let's re(re)visit the API server ...
Revisiting the API server
The Kubernetes API server is a central point of the control plane
Everything connects to the API server:
users (that's us, but also automation like CI/CD)
kubelets
network components (e.g.
kube-proxy, pod network, NPC)controllers; lots of controllers
Some controllers
kube-controller-managerruns built-on controllers(watching Deployments, Nodes, ReplicaSets, and much more)
kube-schedulerruns the scheduler(it's conceptually not different from another controller)
cloud-controller-managertakes care of "cloud stuff"(e.g. provisioning load balancers, persistent volumes...)
Some components mentioned above are also controllers
(e.g. Network Policy Controller)
More controllers
Cloud resources can also be managed by additional controllers
(e.g. the AWS Load Balancer Controller)
Leveraging Ingress resources requires an Ingress Controller
(many options available here; we can even install multiple ones!)
Many add-ons (including CRDs and operators) have controllers as well
🤔 What's even a controller ?!?
What's a controller?
According to the documentation:
Controllers are control loops that
watch the state of your cluster,
then make or request changes where needed.
Each controller tries to move the current cluster state closer to the desired state.
What controllers do
Watch resources
Make changes:
purely at the API level (e.g. Deployment, ReplicaSet controllers)
and/or configure resources (e.g.
kube-proxy)and/or provision resources (e.g. load balancer controller)
Extending Kubernetes with controllers
Random example:
watch resources like Deployments, Services ...
read annotations to configure monitoring
Technically, this is not extending the API
(but it can still be very useful!)
Other ways to extend Kubernetes
Prevent or alter API requests before resources are committed to storage:
Admission Control
Create new resource types leveraging Kubernetes storage facilities:
Custom Resource Definitions
Create new resource types with different storage or different semantics:
Aggregation Layer
Spoiler alert: often, we will combine multiple techniques
(and involve controllers as well!)
Admission controllers
Admission controllers can vet or transform API requests
The diagram on the next slide shows the path of an API request
(courtesy of Banzai Cloud)
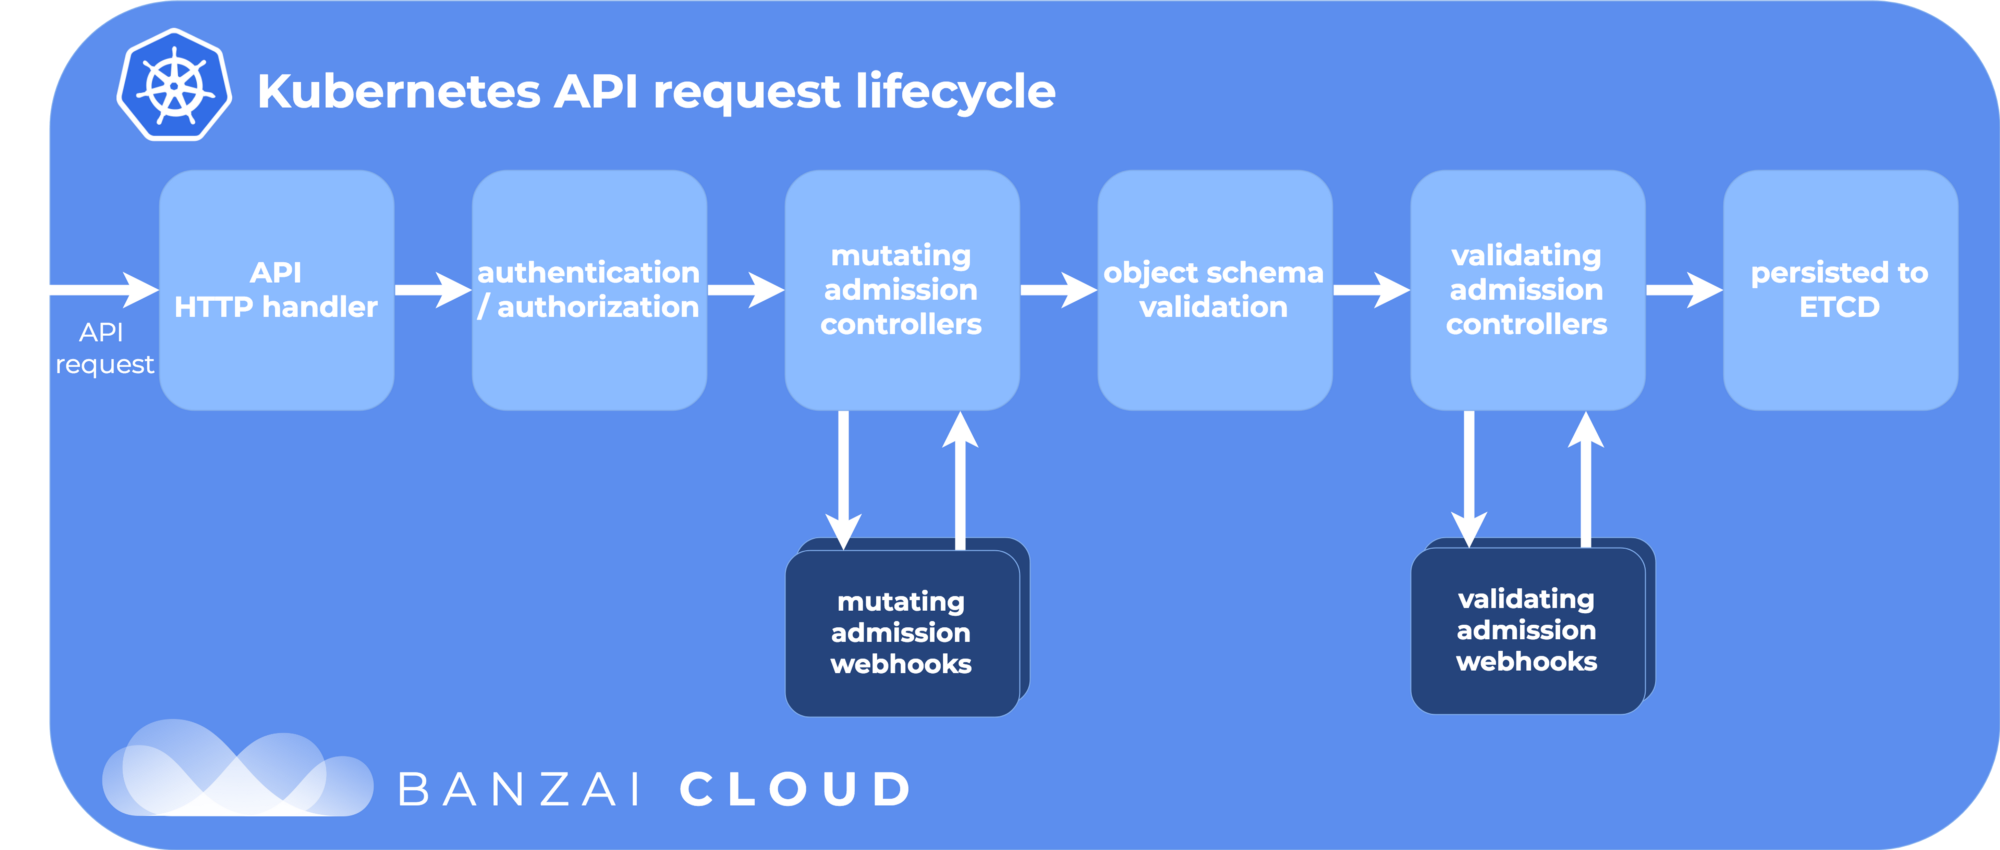
Types of admission controllers
Validating admission controllers can accept/reject the API call
Mutating admission controllers can modify the API request payload
Both types can also trigger additional actions
(e.g. automatically create a Namespace if it doesn't exist)
There are a number of built-in admission controllers
(see documentation for a list)
We can also dynamically define and register our own
Some built-in admission controllers
ServiceAccount:
automatically adds a ServiceAccount to Pods that don't explicitly specify one
LimitRanger:
applies resource constraints specified by LimitRange objects when Pods are created
NamespaceAutoProvision:
automatically creates namespaces when an object is created in a non-existent namespace
Note: #1 and #2 are enabled by default; #3 is not.
Dynamic Admission Control
We can set up admission webhooks to extend the behavior of the API server
The API server will submit incoming API requests to these webhooks
These webhooks can be validating or mutating
Webhooks can be set up dynamically (without restarting the API server)
To setup a dynamic admission webhook, we create a special resource:
a
ValidatingWebhookConfigurationor aMutatingWebhookConfigurationThese resources are created and managed like other resources
(i.e.
kubectl create,kubectl get...)
Webhook Configuration
A ValidatingWebhookConfiguration or MutatingWebhookConfiguration contains:
the address of the webhook
the authentication information to use with the webhook
a list of rules
The rules indicate for which objects and actions the webhook is triggered
(to avoid e.g. triggering webhooks when setting up webhooks)
The webhook server can be hosted in or out of the cluster
Dynamic Admission Examples
Policy control
Sidecar injection
(Used by some service meshes)
Type validation
(More on this later, in the CRD section)
Kubernetes API types
Almost everything in Kubernetes is materialized by a resource
Resources have a type (or "kind")
(similar to strongly typed languages)
We can see existing types with
kubectl api-resourcesWe can list resources of a given type with
kubectl get <type>
Creating new types
We can create new types with Custom Resource Definitions (CRDs)
CRDs are created dynamically
(without recompiling or restarting the API server)
CRDs themselves are resources:
we can create a new type with
kubectl createand some YAMLwe can see all our custom types with
kubectl get crds
After we create a CRD, the new type works just like built-in types
Examples
Representing composite resources
(e.g. clusters like databases, messages queues ...)
Representing external resources
(e.g. virtual machines, object store buckets, domain names ...)
Representing configuration for controllers and operators
(e.g. custom Ingress resources, certificate issuers, backups ...)
Alternate representations of other objects; services and service instances
(e.g. encrypted secret, git endpoints ...)
The aggregation layer
We can delegate entire parts of the Kubernetes API to external servers
This is done by creating APIService resources
(check them with
kubectl get apiservices!)The APIService resource maps a type (kind) and version to an external service
All requests concerning that type are sent (proxied) to the external service
This allows to have resources like CRDs, but that aren't stored in etcd
Example:
metrics-server
Why?
Using a CRD for live metrics would be extremely inefficient
(etcd is not a metrics store; write performance is way too slow)
Instead,
metrics-server:collects metrics from kubelets
stores them in memory
exposes them as PodMetrics and NodeMetrics (in API group metrics.k8s.io)
is registered as an APIService
Drawbacks
Requires a server
... that implements a non-trivial API (aka the Kubernetes API semantics)
If we need REST semantics, CRDs are probably way simpler
Sometimes synchronizing external state with CRDs might do the trick
(unless we want the external state to be our single source of truth)
Service catalog
Service catalog is another extension mechanism
It's not extending the Kubernetes API strictly speaking
(but it still provides new features!)
It doesn't create new types; it uses:
- ClusterServiceBroker
- ClusterServiceClass
- ClusterServicePlan
- ServiceInstance
- ServiceBinding
It uses the Open service broker API
:EN:- Overview of Kubernetes API extensions :FR:- Comment étendre l'API Kubernetes
API server internals
(automatically generated title slide)
API server internals
Understanding the internals of the API server is useful¹:
when extending the Kubernetes API server (CRDs, webhooks...)
when running Kubernetes at scale
Let's dive into a bit of code!
¹And by useful, we mean strongly recommended or else...
The main handler
The API server parses its configuration, and builds a
GenericAPIServer... which contains an
APIServerHandler(src)... which contains a couple of
http.HandlerfieldsRequests go through:
FullhandlerChain(a series of HTTP filters, see next slide)Director(switches the request toGoRestfulContainerorNonGoRestfulMux)
GoRestfulContaineris for "normal" APIs; integrates nicely with OpenAPINonGoRestfulMuxis for everything else (e.g. proxy, delegation)
The chain of handlers
API requests go through a complex chain of filters (src)
(note when reading that code: requests start at the bottom and go up)
This is where authentication, authorization, and admission happen
(as well as a few other things!)
Let's review an arbitrary selection of some of these handlers!
In the following slides, the handlers are in chronological order.
Note: handlers are nested; so they can act at the beginning and end of a request.
WithPanicRecovery
Reminder about Go: there is no exception handling in Go; instead:
functions typically return a composite
(SomeType, error)typewhen things go really bad, the code can call
panic()panic()can be caught withrecover()
(but this is almost never used like an exception handler!)
The API server code is not supposed to
panic()But just in case, we have that handler to prevent (some) crashes
WithRequestInfo (src)
Parse out essential information:
API group, version, namespace, resource, subresource, verb ...
WithRequestInfo: parse out API group+version, Namespace, resource, subresource ...
Maps HTTP verbs (GET, PUT, ...) to Kubernetes verbs (list, get, watch, ...)
HTTP verb mapping
POST → create
PUT → update
PATCH → patch
DELETE
→ delete (if a resource name is specified)
→ deletecollection (otherwise)GET, HEAD
→ get (if a resource name is specified)
→ list (otherwise)
→ watch (if the?watch=trueoption is specified)
WithWaitGroup,
When we shutdown, tells clients (with in-flight requests) to retry
only for "short" requests
for long running requests, the client needs to do more
Long running requests include
watchverb,proxysub-resource
(See also WithTimeoutForNonLongRunningRequests)
AuthN and AuthZ
WithAuthentication: the request goes through a chain of authenticators (src)WithAudit
WithImpersonation: used for e.g.
kubectl ... --as another.userWithPriorityAndFairness or WithMaxInFlightLimit
(
system:masterscan bypass these)WithAuthorization
After all these handlers ...
We get to the "director" mentioned above
Api Groups get installed into the "gorestfulhandler" (src)
REST-ish resources are managed by various handlers (in this directory)
These files show us the code path for each type of request
Request code path
create.go: decode to HubGroupVersion; admission; mutating admission; store
delete.go: validating admission only; deletion
get.go (get, list): directly fetch from rest storage abstraction
patch.go: admission; mutating admission; patch
update.go: decode to HubGroupVersion; admission; mutating admission; store
watch.go: similar to get.go, but with watch logic
(HubGroupVersion = in-memory, "canonical" version.)
:EN:- Kubernetes API server internals :FR:- Fonctionnement interne du serveur API
Custom Resource Definitions
(automatically generated title slide)
Custom Resource Definitions
CRDs are one of the (many) ways to extend the API
CRDs can be defined dynamically
(no need to recompile or reload the API server)
A CRD is defined with a CustomResourceDefinition resource
(CustomResourceDefinition is conceptually similar to a metaclass)
A very simple CRD
The file k8s/coffee-1.yaml describes a very simple CRD representing different kinds of coffee:
apiVersion: apiextensions.k8s.io/v1beta1kind: CustomResourceDefinitionmetadata: name: coffees.container.trainingspec: group: container.training version: v1alpha1 scope: Namespaced names: plural: coffees singular: coffee kind: Coffee shortNames: - cofCreating a CRD
- Let's create the Custom Resource Definition for our Coffee resource
Load the CRD:
kubectl apply -f ~/container.training/k8s/coffee-1.yamlConfirm that it shows up:
kubectl get crds
Creating custom resources
The YAML below defines a resource using the CRD that we just created:
kind: CoffeeapiVersion: container.training/v1alpha1metadata: name: arabicaspec: taste: strong- Create a few types of coffee beans:kubectl apply -f ~/container.training/k8s/coffees.yaml
Viewing custom resources
- By default,
kubectl getonly shows name and age of custom resources
- View the coffee beans that we just created:kubectl get coffees
- We'll see in a bit how to improve that
What can we do with CRDs?
There are many possibilities!
Operators encapsulate complex sets of resources
(e.g.: a PostgreSQL replicated cluster; an etcd cluster...
see awesome operators and OperatorHub to find more)Custom use-cases like gitkube
creates a new custom type,
Remote, exposing a git+ssh serverdeploy by pushing YAML or Helm charts to that remote
Replacing built-in types with CRDs
What's next?
Creating a basic CRD is quick and easy
But there is a lot more that we can (and probably should) do:
improve input with data validation
improve output with custom columns
And of course, we probably need a controller to go with our CRD!
(otherwise, we're just using the Kubernetes API as a fancy data store)
Additional printer columns
We can specify
additionalPrinterColumnsin the CRDThis is similar to
-o custom-columns(map a column name to a path in the object, e.g.
.spec.taste)
additionalPrinterColumns: - jsonPath: .spec.taste description: Subjective taste of that kind of coffee bean name: Taste type: string - jsonPath: .metadata.creationTimestamp name: Age type: dateUsing additional printer columns
- Let's update our CRD using k8s/coffee-3.yaml
Update the CRD:
kubectl apply -f ~/container.training/k8s/coffee-3.yamlLook at our Coffee resources:
kubectl get coffees
Note: we can update a CRD without having to re-create the corresponding resources.
(Good news, right?)
Data validation
By default, CRDs are not validated
(we can put anything we want in the
spec)When creating a CRD, we can pass an OpenAPI v3 schema
(which will then be used to validate resources)
More advanced validation can also be done with admission webhooks, e.g.:
consistency between parameters
advanced integer filters (e.g. odd number of replicas)
things that can change in one direction but not the other
OpenAPI v3 schema example
This is what we have in k8s/coffee-3.yaml:
schema: openAPIV3Schema: type: object required: [ spec ] properties: spec: type: object properties: taste: description: Subjective taste of that kind of coffee bean type: string required: [ taste ]Validation a posteriori
Some of the "coffees" that we defined earlier do not pass validation
How is that possible?
Validation a posteriori
Some of the "coffees" that we defined earlier do not pass validation
How is that possible?
Validation happens at admission
(when resources get written into the database)
Therefore, we can have "invalid" resources in etcd
(they are invalid from the CRD perspective, but the CRD can be changed)
🤔 How should we handle that ?
Versions
If the data format changes, we can roll out a new version of the CRD
(e.g. go from
v1alpha1tov1alpha2)In a CRD we can specify the versions that exist, that are served, and stored
multiple versions can be served
only one can be stored
Kubernetes doesn't automatically migrate the content of the database
However, it can convert between versions when resources are read/written
Conversion
When creating a new resource, the stored version is used
(if we create it with another version, it gets converted)
When getting or watching resources, the requested version is used
(if it is stored with another version, it gets converted)
By default, "conversion" only changes the
apiVersionfield... But we can register conversion webhooks
(see that doc page for details)
Migrating database content
We need to serve a version as long as we store objects in that version
(=as long as the database has at least one object with that version)
If we want to "retire" a version, we need to migrate these objects first
All we have to do is to read and re-write them
(the kube-storage-version-migrator tool can help)
What's next?
Generally, when creating a CRD, we also want to run a controller
(otherwise nothing will happen when we create resources of that type)
The controller will typically watch our custom resources
(and take action when they are created/updated)
CRDs in the wild
How big are these YAML files?
What's the size (e.g. in lines) of each resource?
CRDs in practice
Production-grade CRDs can be extremely verbose
(because of the openAPI schema validation)
This can (and usually will) be managed by a framework
(Ab)using the API server
If we need to store something "safely" (as in: in etcd), we can use CRDs
This gives us primitives to read/write/list objects (and optionally validate them)
The Kubernetes API server can run on its own
(without the scheduler, controller manager, and kubelets)
By loading CRDs, we can have it manage totally different objects
(unrelated to containers, clusters, etc.)
:EN:- Custom Resource Definitions (CRDs) :FR:- Les CRDs (Custom Resource Definitions)
The Aggregation Layer
(automatically generated title slide)
The Aggregation Layer
The aggregation layer is a way to extend the Kubernetes API
It is similar to CRDs
it lets us define new resource types
these resources can then be used with
kubectland other clients
The implementation is very different
CRDs are handled within the API server
the aggregation layer offloads requests to another process
They are designed for very different use-cases
CRDs vs aggregation layer
The Kubernetes API is a REST-ish API with a hierarchical structure
It can be extended with Custom Resource Definifions (CRDs)
Custom resources are managed by the Kubernetes API server
we don't need to write code
the API server does all the heavy lifting
these resources are persisted in Kubernetes' "standard" database
(for most installations, that'setcd)
We can also define resources that are not managed by the API server
(the API server merely proxies the requests to another server)
Which one is best?
For things that "map" well to objects stored in a traditional database:
probably CRDs
For things that "exist" only in Kubernetes and don't represent external resources:
probably CRDs
For things that are read-only, at least from Kubernetes' perspective:
probably aggregation layer
For things that can't be stored in etcd because of size or access patterns:
probably aggregation layer
How are resources organized?
Let's have a look at the Kubernetes API hierarchical structure
We'll ask
kubectlto show us the exacts requests that it's making
Check the URI for a cluster-scope, "core" resource, e.g. a Node:
kubectl -v6 get node node1Check the URI for a cluster-scope, "non-core" resource, e.g. a ClusterRole:
kubectl -v6 get clusterrole view
Core vs non-core
This is the structure of the URIs that we just checked:
/api/v1/nodes/node1↑ ↑ ↑version kind name/apis/rbac.authorization.k8s.io/v1/clusterroles/view↑ ↑ ↑ ↑group version kind nameThere is no group for "core" resources
Or, we could say that the group,
core, is implied
Group-Version-Kind
In the API server, the Group-Version-Kind triple maps to a Go type
(look for all the "GVK" occurrences in the source code!)
In the API server URI router, the GVK is parsed "relatively early"
(so that the server can know which resource we're talking about)
"Well, actually ..." Things are a bit more complicated, see next slides!
Namespaced resources
- What about namespaced resources?
- Check the URI for a namespaced, "core" resource, e.g. a Service:kubectl -v6 get service kubernetes --namespace default
Here are what namespaced resources URIs look like:
/api/v1/namespaces/default/services/kubernetes↑ ↑ ↑ ↑version namespace kind name/apis/apps/v1/namespaces/kube-system/daemonsets/kube-proxy↑ ↑ ↑ ↑ ↑group version namespace kind name
Subresources
Many resources have subresources, for instance:
/status(decouples status updates from other updates)/scale(exposes a consistent interface for autoscalers)/proxy(allows access to HTTP resources)/portforward(used bykubectl port-forward)/logs(access pod logs)
These are added at the end of the URI
Accessing a subresource
List
kube-proxypods:kubectl get pods --namespace=kube-system --selector=k8s-app=kube-proxyPODNAME=$(kubectl get pods --namespace=kube-system --selector=k8s-app=kube-proxy \-o json | jq -r .items[0].metadata.name)Execute a command in a pod, showing the API requests:
kubectl -v6 exec --namespace=kube-system $PODNAME -- echo hello world
The full request looks like:
POST https://.../api/v1/namespaces/kube-system/pods/kube-proxy-c7rlw/exec?command=echo&command=hello&command=world&container=kube-proxy&stderr=true&stdout=trueListing what's supported on the server
- There are at least three useful commands to introspect the API server
List resources types, their group, kind, short names, and scope:
kubectl api-resourcesList API groups + versions:
kubectl api-versionsList APIServices:
kubectl get apiservices
Listing what's supported on the server
- There are at least three useful commands to introspect the API server
List resources types, their group, kind, short names, and scope:
kubectl api-resourcesList API groups + versions:
kubectl api-versionsList APIServices:
kubectl get apiservices
🤔 What's the difference between the last two?
API registration
kubectl api-versionsshows all API groups, includingapiregistration.k8s.iokubectl get apiservicesshows the "routing table" for API requestsThe latter doesn't show
apiregistration.k8s.io(APIServices belong to
apiregistration.k8s.io)Most API groups are
Local(handled internally by the API server)If we're running the
metrics-server, it should handlemetrics.k8s.ioThis is an API group handled outside of the API server
This is the aggregation layer!
Finding resources
The following assumes that metrics-server is deployed on your cluster.
Check that the metrics.k8s.io is registered with
metrics-server:kubectl get apiservices | grep metrics.k8s.ioCheck the resource kinds registered in the metrics.k8s.io group:
kubectl api-resources --api-group=metrics.k8s.io
(If the output of either command is empty, install metrics-server first.)
nodes vs nodes
- We can have multiple resources with the same name
Look for resources named
node:kubectl api-resources | grep -w nodesCompare the output of both commands:
kubectl get nodeskubectl get nodes.metrics.k8s.io
nodes vs nodes
- We can have multiple resources with the same name
Look for resources named
node:kubectl api-resources | grep -w nodesCompare the output of both commands:
kubectl get nodeskubectl get nodes.metrics.k8s.io
🤔 What are the second kind of nodes? How can we see what's really in them?
Node vs NodeMetrics
nodes.metrics.k8s.io(aka NodeMetrics) don't have fancy printer columnsBut we can look at the raw data (with
-o jsonor-o yaml)
- Look at NodeMetrics objects with one of these commands:kubectl get -o yaml nodes.metrics.k8s.iokubectl get -o yaml NodeMetrics
Node vs NodeMetrics
nodes.metrics.k8s.io(aka NodeMetrics) don't have fancy printer columnsBut we can look at the raw data (with
-o jsonor-o yaml)
- Look at NodeMetrics objects with one of these commands:kubectl get -o yaml nodes.metrics.k8s.iokubectl get -o yaml NodeMetrics
💡 Alright, these are the live metrics (CPU, RAM) for our nodes.
An easier way to consume metrics
- We might have seen these metrics before ... With an easier command!
An easier way to consume metrics
- We might have seen these metrics before ... With an easier command!
Display node metrics:
kubectl top nodesCheck which API requests happen behind the scenes:
kubectl top nodes -v6
Aggregation layer in practice
We can write an API server to handle a subset of the Kubernetes API
Then we can register that server by creating an APIService resource
- Check the definition used for the
metrics-server:kubectl describe apiservices v1beta1.metrics.k8s.io
Group priority is used when multiple API groups provide similar kinds
(e.g.
nodesandnodes.metrics.k8s.ioas seen earlier)
Authentication flow
We have two Kubernetes API servers:
"aggregator" (the main one; clients connect to it)
"aggregated" (the one providing the extra API; aggregator connects to it)
Aggregator deals with client authentication
Aggregator authenticates with aggregated using mutual TLS
Aggregator passes (/forwards/proxies/...) requests to aggregated
Aggregated performs authorization by calling back aggregator
("can subject X perform action Y on resource Z?")
This doc page has very nice swim lanes showing that flow.
Discussion
Aggregation layer is great for metrics
(fast-changing, ephemeral data, that would be outrageously bad for etcd)
It could be a good fit to expose other REST APIs as a pass-thru
(but it's more common to see CRDs instead)
:EN:- The aggregation layer :FR:- Étendre l'API avec le aggregation layer k8s/aggregation-layer.md
Dynamic Admission Control
(automatically generated title slide)
Dynamic Admission Control
This is one of the many ways to extend the Kubernetes API
High level summary: dynamic admission control relies on webhooks that are ...
dynamic (can be added/removed on the fly)
running inside our outside the cluster
validating (yay/nay) or mutating (can change objects that are created/updated)
selective (can be configured to apply only to some kinds, some selectors...)
mandatory or optional (should it block operations when webhook is down?)
Used for themselves (e.g. policy enforcement) or as part of operators
Use cases
Some examples ...
Stand-alone admission controllers
validating: policy enforcement (e.g. quotas, naming conventions ...)
mutating: inject or provide default values (e.g. pod presets)
Admission controllers part of a greater system
validating: advanced typing for operators
mutating: inject sidecars for service meshes
You said dynamic?
Some admission controllers are built in the API server
They are enabled/disabled through Kubernetes API server configuration
(e.g.
--enable-admission-plugins/--disable-admission-pluginsflags)Here, we're talking about dynamic admission controllers
They can be added/remove while the API server is running
(without touching the configuration files or even having access to them)
This is done through two kinds of cluster-scope resources:
ValidatingWebhookConfiguration and MutatingWebhookConfiguration
You said webhooks?
A ValidatingWebhookConfiguration or MutatingWebhookConfiguration contains:
a resource filter
(e.g. "all pods", "deployments in namespace xyz", "everything"...)an operations filter
(e.g. CREATE, UPDATE, DELETE)the address of the webhook server
Each time an operation matches the filters, it is sent to the webhook server
What gets sent exactly?
The API server will
POSTa JSON object to the webhookThat object will be a Kubernetes API message with
kindAdmissionReviewIt will contain a
requestfield, with, notably:request.uid(to be used when replying)request.object(the object created/deleted/changed)request.oldObject(when an object is modified)request.userInfo(who was making the request to the API in the first place)
(See the documentation for a detailed example showing more fields.)
How should the webhook respond?
By replying with another
AdmissionReviewin JSONIt should have a
responsefield, with, notably:response.uid(matching therequest.uid)response.allowed(true/false)response.status.message(optional string; useful when denying requests)response.patchType(when a mutating webhook changes the object; e.g.json)response.patch(the patch, encoded in base64)
What if the webhook does not respond?
If "something bad" happens, the API server follows the
failurePolicyoptionthis is a per-webhook option (specified in the webhook configuration)
it can be
Fail(the default) orIgnore("allow all, unmodified")
What's "something bad"?
webhook responds with something invalid
webhook takes more than 10 seconds to respond
(this can be changed withtimeoutSecondsfield in the webhook config)webhook is down or has invalid certificates
(TLS! It's not just a good idea; for admission control, it's the law!)
What did you say about TLS?
The webhook configuration can indicate:
either
urlof the webhook server (has to begin withhttps://)or
service.nameandservice.namespaceof a Service on the cluster
In the latter case, the Service has to accept TLS connections on port 443
It has to use a certificate with CN
<name>.<namespace>.svc(and a
subjectAltNameextension withDNS:<name>.<namespace>.svc)The certificate needs to be valid (signed by a CA trusted by the API server)
... alternatively, we can pass a
caBundlein the webhook configuration
Webhook server inside or outside
"Outside" webhook server is defined with
urloptionconvenient for external webooks (e.g. tamper-resistent audit trail)
also great for initial development (e.g. with ngrok)
requires outbound connectivity (duh) and can become a SPOF
"Inside" webhook server is defined with
serviceoptionconvenient when the webhook needs to be deployed and managed on the cluster
also great for air gapped clusters
development can be harder (but tools like Tilt can help)
Developing a simple admission webhook
We're going to register a custom webhook!
First, we'll just dump the
AdmissionRequestobject(using a little Node app)
Then, we'll implement a strict policy on a specific label
(using a little Flask app)
Development will happen in local containers, plumbed with ngrok
The we will deploy to the cluster 🔥
Running the webhook locally
We prepared a Docker Compose file to start the whole stack
(the Node "echo" app, the Flask app, and one ngrok tunnel for each of them)
Go to the webhook directory:
cd ~/container.training/webhooks/admissionStart the webhook in Docker containers:
docker-compose up
Note the URL in ngrok-echo_1 looking like url=https://xxxx.ngrok.io.
What's ngrok?
Ngrok provides secure tunnels to access local services
Example: run
ngrok http 1234ngrokwill display a publicly-available URL (e.g. https://xxxxyyyyzzzz.ngrok.io)Connections to https://xxxxyyyyzzzz.ngrok.io will terminate at
localhost:1234Basic product is free; extra features (vanity domains, end-to-end TLS...) for $$$
Perfect to develop our webhook!
Probably not for production, though
(webhook requests and responses now pass through the ngrok platform)
Update the webhook configuration
We have a webhook configuration in
k8s/webhook-configuration.yamlWe need to update the configuration with the correct
url
Edit the webhook configuration manifest:
vim k8s/webhook-configuration.yamlUncomment the
url:lineUpdate the
.ngrok.ioURL with the URL shown by ComposeSave and quit
Register the webhook configuration
Just after we register the webhook, it will be called for each matching request
(CREATE and UPDATE on Pods in all namespaces)
The
failurePolicyisIgnore(so if the webhook server is down, we can still create pods)
- Register the webhook:kubectl apply -f k8s/webhook-configuration.yaml
It is strongly recommended to tail the logs of the API server while doing that.
Create a pod
- Let's create a pod and try to set a
colorlabel
Create a pod named
chroma:kubectl run --restart=Never chroma --image=nginxAdd a label
colorset topink:kubectl label pod chroma color=pink
We should see the AdmissionReview objects in the Compose logs.
Note: the webhook doesn't do anything (other than printing the request payload).
Use the "real" admission webhook
We have a small Flask app implementing a particular policy on pod labels:
if a pod sets a label
color, it must beblue,green,redonce that
colorlabel is set, it cannot be removed or changed
That Flask app was started when we did
docker-compose upearlierIt is exposed through its own ngrok tunnel
We are going to use that webhook instead of the other one
(by changing only the
urlfield in the ValidatingWebhookConfiguration)
Update the webhook configuration
First, check the ngrok URL of the tunnel for the Flask app:
docker-compose logs ngrok-flaskThen, edit the webhook configuration:
kubectl edit validatingwebhookconfiguration admission.container.trainingFind the
url:field with the.ngrok.ioURL and update itSave and quit; the new configuration is applied immediately
Verify the behavior of the webhook
Try to create a few pods and/or change labels on existing pods
What happens if we try to make changes to the earlier pod?
(the one that has
label=pink)
Deploying the webhook on the cluster
Let's see what's needed to self-host the webhook server!
The webhook needs to be reachable through a Service on our cluster
The Service needs to accept TLS connections on port 443
We need a proper TLS certificate:
with the right
CNandsubjectAltName(<servicename>.<namespace>.svc)signed by a trusted CA
We can either use a "real" CA, or use the
caBundleoption to specify the CA cert(the latter makes it easy to use self-signed certs)
In practice
We're going to generate a key pair and a self-signed certificate
We will store them in a Secret
We will run the webhook in a Deployment, exposed with a Service
We will update the webhook configuration to use that Service
The Service will be named
admission, in Namespacewebhooks(keep in mind that the ValidatingWebhookConfiguration itself is at cluster scope)
Let's get to work!
Make sure we're in the right directory:
cd ~/container.training/webhooks/admissionCreate the namespace:
kubectl create namespace webhooksSwitch to the namespace:
kubectl config set-context --current --namespace=webhooks
Deploying the webhook
Normally, we would author an image for this
Since our webhook is just one Python source file ...
... we'll store it in a ConfigMap, and install dependencies on the fly
Load the webhook source in a ConfigMap:
kubectl create configmap admission --from-file=flask/webhook.pyCreate the Deployment and Service:
kubectl apply -f k8s/webhook-server.yaml
Generating the key pair and certificate
Let's call OpenSSL to the rescue!
(of course, there are plenty others options; e.g.
cfssl)
Generate a self-signed certificate:
NAMESPACE=webhooksSERVICE=admissionCN=$SERVICE.$NAMESPACE.svcopenssl req -x509 -newkey rsa:4096 -nodes -keyout key.pem -out cert.pem \-days 30 -subj /CN=$CN -addext subjectAltName=DNS:$CNLoad up the key and cert in a Secret:
kubectl create secret tls admission --cert=cert.pem --key=key.pem
Update the webhook configuration
- Let's reconfigure the webhook to use our Service instead of ngrok
Edit the webhook configuration manifest:
vim k8s/webhook-configuration.yamlComment out the
url:lineUncomment the
service:sectionSave, quit
Update the webhook configuration:
kubectl apply -f k8s/webhook-configuration.yaml
Add our self-signed cert to the caBundle
The API server won't accept our self-signed certificate
We need to add it to the
caBundlefield in the webhook configurationThe
caBundlewill be ourcert.pemfile, encoded in base64
Shell to the rescue!
Load up our cert and encode it in base64:
CA=$(base64 -w0 < cert.pem)Define a patch operation to update the
caBundle:PATCH='[{"op": "replace","path": "/webhooks/0/clientConfig/caBundle","value":"'$CA'"}]'Patch the webhook configuration:
kubectl patch validatingwebhookconfiguration \admission.webhook.container.training \--type='json' -p="$PATCH"
Try it out!
Keep an eye on the API server logs
Tail the logs of the pod running the webhook server
Create a few pods; we should see requests in the webhook server logs
Check that the label
coloris enforced correctly(it should only allow values of
red,green,blue)
:EN:- Dynamic admission control with webhooks :FR:- Contrôle d'admission dynamique (webhooks)
Operators
(automatically generated title slide)
Operators
An operator represents human operational knowledge in software,
to reliably manage an application.
— CoreOS
Examples:
Deploying and configuring replication with MySQL, PostgreSQL ...
Setting up Elasticsearch, Kafka, RabbitMQ, Zookeeper ...
Reacting to failures when intervention is needed
Scaling up and down these systems
What are they made from?
Operators combine two things:
Custom Resource Definitions
controller code watching the corresponding resources and acting upon them
A given operator can define one or multiple CRDs
The controller code (control loop) typically runs within the cluster
(running as a Deployment with 1 replica is a common scenario)
But it could also run elsewhere
(nothing mandates that the code run on the cluster, as long as it has API access)
Why use operators?
Kubernetes gives us Deployments, StatefulSets, Services ...
These mechanisms give us building blocks to deploy applications
They work great for services that are made of N identical containers
(like stateless ones)
They also work great for some stateful applications like Consul, etcd ...
(with the help of highly persistent volumes)
They're not enough for complex services:
where different containers have different roles
where extra steps have to be taken when scaling or replacing containers
Use-cases for operators
Systems with primary/secondary replication
Examples: MariaDB, MySQL, PostgreSQL, Redis ...
Systems where different groups of nodes have different roles
Examples: ElasticSearch, MongoDB ...
Systems with complex dependencies (that are themselves managed with operators)
Examples: Flink or Kafka, which both depend on Zookeeper
More use-cases
Representing and managing external resources
(Example: AWS S3 Operator)
Managing complex cluster add-ons
(Example: Istio operator)
Deploying and managing our applications' lifecycles
(more on that later)
How operators work
An operator creates one or more CRDs
(i.e., it creates new "Kinds" of resources on our cluster)
The operator also runs a controller that will watch its resources
Each time we create/update/delete a resource, the controller is notified
(we could write our own cheap controller with
kubectl get --watch)
Deploying our apps with operators
It is very simple to deploy with
kubectl create deployment/kubectl exposeWe can unlock more features by writing YAML and using
kubectl applyKustomize or Helm let us deploy in multiple environments
(and adjust/tweak parameters in each environment)
We can also use an operator to deploy our application
Pros and cons of deploying with operators
The app definition and configuration is persisted in the Kubernetes API
Multiple instances of the app can be manipulated with
kubectl getWe can add labels, annotations to the app instances
Our controller can execute custom code for any lifecycle event
However, we need to write this controller
We need to be careful about changes
(what happens when the resource
specis updated?)
Operators are not magic
Look at this ElasticSearch resource definition:
What should happen if we flip the TLS flag? Twice?
What should happen if we add another group of nodes?
What if we want different images or parameters for the different nodes?
Operators can be very powerful.
But we need to know exactly the scenarios that they can handle.
:EN:- Kubernetes operators :FR:- Les opérateurs
Designing an operator
(automatically generated title slide)
Designing an operator
Once we understand CRDs and operators, it's tempting to use them everywhere
Yes, we can do (almost) everything with operators ...
... But should we?
Very often, the answer is “no!”
Operators are powerful, but significantly more complex than other solutions
When should we (not) use operators?
Operators are great if our app needs to react to cluster events
(nodes or pods going down, and requiring extensive reconfiguration)
Operators might be helpful to encapsulate complexity
(manipulate one single custom resource for an entire stack)
Operators are probably overkill if a Helm chart would suffice
That being said, if we really want to write an operator ...
Read on!
What does it take to write an operator?
Writing a quick-and-dirty operator, or a POC/MVP, is easy
Writing a robust operator is hard
We will describe the general idea
We will identify some of the associated challenges
We will list a few tools that can help us
Top-down vs. bottom-up
Both approaches are possible
Let's see what they entail, and their respective pros and cons
Top-down approach
Start with high-level design (see next slide)
Pros:
- can yield cleaner design that will be more robust
Cons:
must be able to anticipate all the events that might happen
design will be better only to the extent of what we anticipated
hard to anticipate if we don't have production experience
High-level design
What are we solving?
(e.g.: geographic databases backed by PostGIS with Redis caches)
What are our use-cases, stories?
(e.g.: adding/resizing caches and read replicas; load balancing queries)
What kind of outage do we want to address?
(e.g.: loss of individual node, pod, volume)
What are our non-features, the things we don't want to address?
(e.g.: loss of datacenter/zone; differentiating between read and write queries;
cache invalidation; upgrading to newer major versions of Redis, PostGIS, PostgreSQL)
Low-level design
What Custom Resource Definitions do we need?
(one, many?)
How will we store configuration information?
(part of the CRD spec fields, annotations, other?)
Do we need to store state? If so, where?
state that is small and doesn't change much can be stored via the Kubernetes API
(e.g.: leader information, configuration, credentials)things that are big and/or change a lot should go elsewhere
(e.g.: metrics, bigger configuration file like GeoIP)
What can we store via the Kubernetes API?
The API server stores most Kubernetes resources in etcd
Etcd is designed for reliability, not for performance
If our storage needs exceed what etcd can offer, we need to use something else:
either directly
or by extending the API server
(for instance by using the agregation layer, like metrics server does)
Bottom-up approach
Start with existing Kubernetes resources (Deployment, Stateful Set...)
Run the system in production
Add scripts, automation, to facilitate day-to-day operations
Turn the scripts into an operator
Pros: simpler to get started; reflects actual use-cases
Cons: can result in convoluted designs requiring extensive refactor
General idea
Our operator will watch its CRDs and associated resources
Drawing state diagrams and finite state automata helps a lot
It's OK if some transitions lead to a big catch-all "human intervention"
Over time, we will learn about new failure modes and add to these diagrams
It's OK to start with CRD creation / deletion and prevent any modification
(that's the easy POC/MVP we were talking about)
Presentation and validation will help our users
(more on that later)
Challenges
Reacting to infrastructure disruption can seem hard at first
Kubernetes gives us a lot of primitives to help:
Pods and Persistent Volumes will eventually recover
Stateful Sets give us easy ways to "add N copies" of a thing
The real challenges come with configuration changes
(i.e., what to do when our users update our CRDs)
Keep in mind that some of the largest cloud outages haven't been caused by natural catastrophes, or even code bugs, but by configuration changes k8s/operators-design.md
Configuration changes
It is helpful to analyze and understand how Kubernetes controllers work:
watch resource for modifications
compare desired state (CRD) and current state
issue actions to converge state
Configuration changes will probably require another state diagram or FSA
Again, it's OK to have transitions labeled as "unsupported"
(i.e. reject some modifications because we can't execute them)
Tools
CoreOS / RedHat Operator Framework
GitHub | Blog | Intro talk | Deep dive talk | Simple example
Kubernetes Operator Pythonic Framework (KOPF)
Mesosphere Kubernetes Universal Declarative Operator (KUDO)
GitHub | Blog | Docs | Zookeeper example
Kubebuilder (Go, very close to the Kubernetes API codebase)
Validation
By default, a CRD is "free form"
(we can put pretty much anything we want in it)
When creating a CRD, we can provide an OpenAPI v3 schema (Example)
The API server will then validate resources created/edited with this schema
If we need a stronger validation, we can use a Validating Admission Webhook:
run an admission webhook server to receive validation requests
register the webhook by creating a ValidatingWebhookConfiguration
each time the API server receives a request matching the configuration,
the request is sent to our server for validation
Presentation
By default,
kubectl get mycustomresourcewon't display much information(just the name and age of each resource)
When creating a CRD, we can specify additional columns to print (Example, Docs)
By default,
kubectl describe mycustomresourcewill also be generickubectl describecan show events related to our custom resources(for that, we need to create Event resources, and fill the
involvedObjectfield)For scalable resources, we can define a
scalesub-resourceThis will enable the use of
kubectl scaleand other scaling-related operations
About scaling
It is possible to use the HPA (Horizontal Pod Autoscaler) with CRDs
But it is not always desirable
The HPA works very well for homogenous, stateless workloads
For other workloads, your mileage may vary
Some systems can scale across multiple dimensions
(for instance: increase number of replicas, or number of shards?)
If autoscaling is desired, the operator will have to take complex decisions
(example: Zalando's Elasticsearch Operator (Video))
Versioning
As our operator evolves over time, we may have to change the CRD
(add, remove, change fields)
Like every other resource in Kubernetes, custom resources are versioned
When creating a CRD, we need to specify a list of versions
Versions can be marked as
storedand/orserved
Stored version
Exactly one version has to be marked as the
storedversionAs the name implies, it is the one that will be stored in etcd
Resources in storage are never converted automatically
(we need to read and re-write them ourselves)
Yes, this means that we can have different versions in etcd at any time
Our code needs to handle all the versions that still exist in storage
Served versions
By default, the Kubernetes API will serve resources "as-is"
(using their stored version)
It will assume that all versions are compatible storage-wise
(i.e. that the spec and fields are compatible between versions)
We can provide conversion webhooks to "translate" requests
(the alternative is to upgrade all stored resources and stop serving old versions)
Operator reliability
Remember that the operator itself must be resilient
(e.g.: the node running it can fail)
Our operator must be able to restart and recover gracefully
Do not store state locally
(unless we can reconstruct that state when we restart)
As indicated earlier, we can use the Kubernetes API to store data:
in the custom resources themselves
in other resources' annotations
Beyond CRDs
CRDs cannot use custom storage (e.g. for time series data)
CRDs cannot support arbitrary subresources (like logs or exec for Pods)
CRDs cannot support protobuf (for faster, more efficient communication)
If we need these things, we can use the aggregation layer instead
The aggregation layer proxies all requests below a specific path to another server
(this is used e.g. by the metrics server)
This documentation page compares the features of CRDs and API aggregation
:EN:- Guidelines to design our own operators :FR:- Comment concevoir nos propres opérateurs
Kubebuilder
(automatically generated title slide)
Kubebuilder
Writing a quick and dirty operator is (relatively) easy
Doing it right, however ...
Kubebuilder
Writing a quick and dirty operator is (relatively) easy
Doing it right, however ...
We need:
proper CRD with schema validation
controller performing a reconcilation loop
manage errors, retries, dependencies between resources
maybe webhooks for admission and/or conversion
😱
Frameworks
There are a few frameworks available out there:
kubebuilder (book): go-centric, very close to Kubernetes' core types
operator-framework: higher level; also supports Ansible and Helm
KUDO: declarative operators written in YAML
KOPF: operators in Python
...
Kubebuilder workflow
Kubebuilder will create scaffolding for us
(Go stubs for types and controllers)
Then we edit these types and controllers files
Kubebuilder generates CRD manifests from our type definitions
(and regenerates the manifests whenver we update the types)
It also gives us tools to quickly run the controller against a cluster
(not necessarily on the cluster)
Our objective
We're going to implement a useless machine
basic example | playful example | advanced example | another advanced example
A machine manifest will look like this:
kind: MachineapiVersion: useless.container.training/v1alpha1metadata:name: machine-1spec:# Our useless operator will change that to "down"switchPosition: upEach time we change the
switchPosition, the operator will move it back todown
(This is inspired by the uselessoperator written by L Körbes. Highly recommend!💯)
Local vs remote
Building Go code can be a little bit slow on our modest lab VMs
It will typically be much faster on a local machine
All the demos and labs in this section will run fine either way!
Preparation
Install Go
(on our VMs:
sudo snap install go --classic)Install kubebuilder
(get a release, untar, move the
kubebuilderbinary to the$PATH)Initialize our workspace:
mkdir uselesscd uselessgo mod init container.training/uselesskubebuilder init --domain container.training
Create scaffolding
Create a type and corresponding controller:
kubebuilder create api --group useless --version v1alpha1 --kind MachineAnswer
yto both questionsThen we need to edit the type that just got created!
Edit type
Edit api/v1alpha1/machine_types.go.
Add the switchPosition field in the spec structure:
// MachineSpec defines the desired state of Machinetype MachineSpec struct { // Position of the switch on the machine, for instance up or down. SwitchPosition string ``json:"switchPosition,omitempty"``}⚠️ The backticks above should be simple backticks, not double-backticks. Sorry.
Go markers
We can use Go marker comments to give controller-gen extra details about how to handle our type, for instance:
// +kubebuilder:object:root=true// +kubebuilder:subresource:status// +kubebuilder:printcolumn:JSONPath=".spec.switchPosition",name=Position,type=string(See marker syntax, CRD generation, CRD validation )
Using CRD v1
By default, kubebuilder generates v1alpha1 CRDs
If we want to generate v1 CRDs:
edit
Makefileupdate
crd:crdVersions=v1
Installing the CRD
After making these changes, we can run make install.
This will build the Go code, but also:
generate the CRD manifest
and apply the manifest to the cluster
Creating a machine
Edit config/samples/useless_v1alpha1_machine.yaml:
kind: MachineapiVersion: useless.container.training/v1alpha1metadata: name: machine-1spec: # Our useless operator will change that to "down" switchPosition: up... and apply it to the cluster.
Designing the controller
Our controller needs to:
notice when a
switchPositionis notdownmove it to
downwhen that happens
Later, we can add fancy improvements (wait a bit before moving it, etc.)
Reconciler logic
Kubebuilder will call our reconciler when necessary
When necessary = when changes happen ...
on our resource
or resources that it watches (related resources)
After "doing stuff", the reconciler can return ...
ctrl.Result{},nil= all is goodctrl.Result{Requeue...},nil= all is good, but call us back in a bitctrl.Result{},err= something's wrong, try again later
Loading an object
Open controllers/machine_controller.go and add that code in the Reconcile method:
var machine uselessv1alpha1.Machineif err := r.Get(ctx, req.NamespacedName, &machine); err != nil { log.Info("error getting object") return ctrl.Result{}, err}r.Log.Info( "reconciling", "machine", req.NamespaceName, "switchPosition", machine.Spec.SwitchPosition,)Running the controller
Our controller is not done yet, but let's try what we have right now!
This will compile the controller and run it:
make runThen:
- create a machine
- change the
switchPosition - delete the machine
Running the controller
Our controller is not done yet, but let's try what we have right now!
This will compile the controller and run it:
make runThen:
- create a machine
- change the
switchPosition - delete the machine
🤔
IgnoreNotFound
When we are called for object deletion, the object has already been deleted.
(Unless we're using finalizers, but that's another story.)
When we return err, the controller will try to access the object ...
... We need to tell it to not do that.
Don't just return err, but instead, wrap it around client.IgnoreNotFound:
return ctrl.Result{}, client.IgnoreNotFound(err)Update the code, make run again, create/change/delete again.
🎉
Updating the machine
Let's try to update the machine like this:
if machine.Spec.SwitchPosition != "down" { machine.Spec.SwitchPosition = "down" if err := r.Update(ctx, &machine); err != nil { log.Info("error updating switch position") return ctrl.Result{}, client.IgnoreNotFound(err) }}Again - update, make run, test.
Spec vs Status
Spec = desired state
Status = observed state
If Status is lost, the controller should be able to reconstruct it
(maybe with degraded behavior in the meantime)
Status will almost always be a sub-resource
(so that it can be updated separately "cheaply")
Spec vs Status (in depth)
The
/statussubresource is handled differently by the API serverUpdates to
/statusdon't alter the rest of the objectConversely, updates to the object ignore changes in the status
(See the docs for the fine print.)
"Improving" our controller
We want to wait a few seconds before flipping the switch
Let's add the following line of code to the controller:
time.Sleep(5 * time.Second)make run, create a few machines, observe what happens
"Improving" our controller
We want to wait a few seconds before flipping the switch
Let's add the following line of code to the controller:
time.Sleep(5 * time.Second)make run, create a few machines, observe what happens
💡 Concurrency!
Controller logic
Our controller shouldn't block (think "event loop")
There is a queue of objects that need to be reconciled
We can ask to be put back on the queue for later processing
When we need to block (wait for something to happen), two options:
ask for a requeue ("call me back later")
yield because we know we will be notified by another resource
To requeue ...
return ctrl.Result{RequeueAfter: 1 * time.Second}
That means: "try again in 1 second, and I will check if progress was made"
This does not guarantee that we will be called exactly 1 second later:
we might be called before (if other changes happen)
we might be called after (if the controller is busy with other objects)
If we are waiting for another resource to change, there is an even better way!
... or not to requeue
return ctrl.Result{}, nil
That means: "no need to set an alarm; we'll be notified some other way"
Use this if we are waiting for another resource to update
(e.g. a LoadBalancer to be provisioned, a Pod to be ready...)
For this to work, we need to set a watch (more on that later)
"Improving" our controller, take 2
- Let's store in the machine status the moment when we saw it
// +kubebuilder:printcolumn:JSONPath=".status.seenAt",name=Seen,type=datetype MachineStatus struct { // Time at which the machine was noticed by our controller. SeenAt *metav1.Time ``json:"seenAt,omitempty"``}⚠️ The backticks above should be simple backticks, not double-backticks. Sorry.
Note: date fields don't display timestamps in the future.
(That's why for this example it's simpler to use seenAt rather than changeAt.)
Set seenAt
Let's add the following block in our reconciler:
if machine.Status.SeenAt == nil { now := metav1.Now() machine.Status.SeenAt = &now if err := r.Status().Update(ctx, &machine); err != nil { log.Info("error updating status.seenAt") return ctrl.Result{}, client.IgnoreNotFound(err) } return ctrl.Result{RequeueAfter: 5 * time.Second}, nil}(If needed, add metav1 "k8s.io/apimachinery/pkg/apis/meta/v1" to our imports.)
Use seenAt
Our switch-position-changing code can now become:
if machine.Spec.SwitchPosition != "down" { now := metav1.Now() changeAt := machine.Status.SeenAt.Time.Add(5 * time.Second) if now.Time.After(changeAt) { machine.Spec.SwitchPosition = "down" if err := r.Update(ctx, &machine); err != nil { log.Info("error updating switch position") return ctrl.Result{}, client.IgnoreNotFound(err) } }}make run, create a few machines, tweak their switches.
Owner and dependents
Next, let's see how to have relationships between objects!
We will now have two kinds of objects: machines, and switches
Machines should have at least one switch, possibly multiple ones
The position will now be stored in the switch, not the machine
The machine will also expose the combined state of the switches
The switches will be tied to their machine through a label
(See next slide for an example)
Switches and machines
[jp@hex ~]$ kubectl get machinesNAME SWITCHES POSITIONSmachine-cz2vl 3 dddmachine-vf4xk 1 d[jp@hex ~]$ kubectl get switches --show-labels NAME POSITION SEEN LABELSswitch-6wmjw down machine=machine-cz2vlswitch-b8csg down machine=machine-cz2vlswitch-fl8dq down machine=machine-cz2vlswitch-rc59l down machine=machine-vf4xk(The field status.positions shows the first letter of the position of each switch.)
Tasks
Create the new resource type (but don't create a controller):
kubebuilder create api --group useless --version v1alpha1 --kind SwitchUpdate machine_types.go and switch_types.go.
Implement the logic so that the controller flips all switches down immediately.
Then change it so that a given machine doesn't flip more than one switch every 5 seconds.
See next slides for hints!
Listing objects
We can use the List method with filters:
var switches uselessv1alpha1.SwitchListif err := r.List(ctx, &switches, client.InNamespace(req.Namespace), client.MatchingLabels{"machine": req.Name}, ); err != nil { log.Error(err, "unable to list switches of the machine") return ctrl.Result{}, client.IgnoreNotFound(err)}log.Info("Found switches", "switches", switches)Creating objects
We can use the Create method to create a new object:
sw := uselessv1alpha1.Switch{ TypeMeta: metav1.TypeMeta{ APIVersion: uselessv1alpha1.GroupVersion.String(), Kind: "Switch", }, ObjectMeta: metav1.ObjectMeta{ GenerateName: "switch-", Namespace: machine.Namespace, Labels: map[string]string{"machine": machine.Name}, }, Spec: uselessv1alpha1.SwitchSpec{ Position: "down", },}if err := r.Create(ctx, &sw); err != nil { ...Watches
Our controller will correctly flip switches when it starts
It will also react to machine updates
But it won't react if we directly touch the switches!
By default, it only monitors machines, not switches
We need to tell it to watch switches
We also need to tell it how to map a switch to its machine
Mapping a switch to its machine
Define the following helper function:
func (r *MachineReconciler) machineOfSwitch(obj handler.MapObject) []ctrl.Request { r.Log.Debug("mos", "obj", obj) return []ctrl.Request{ ctrl.Request{ NamespacedName: types.NamespacedName{ Name: obj.Meta.GetLabels()["machine"], Namespace: obj.Meta.GetNamespace(), }, }, }}Telling the controller to watch switches
Update the SetupWithManager method in the controller:
func (r *MachineReconciler) SetupWithManager(mgr ctrl.Manager) error { return ctrl.NewControllerManagedBy(mgr). For(&uselessv1alpha1.Machine{}). Owns(&uselessv1alpha1.Switch{}). Watches( &source.Kind{Type: &uselessv1alpha1.Switch{}}, &handler.EnqueueRequestsFromMapFunc{ ToRequests: handler.ToRequestsFunc(r.machineOfSwitch), }). Complete(r)}After this, our controller should now react to switch changes.
Bonus points
Handle "scale down" of a machine (by deleting extraneous switches)
Automatically delete switches when a machine is deleted
(ideally, using ownership information)
Test corner cases (e.g. changing a switch label)
Acknowledgements
Useless Operator, by L Körbes
code | video (EN) | video (PT)
Zero To Operator, by Solly Ross
The kubebuilder book
:EN:- Implementing an operator with kubebuilder :FR:- Implémenter un opérateur avec kubebuilder
Sealed Secrets
(automatically generated title slide)
Sealed Secrets
Kubernetes provides the "Secret" resource to store credentials, keys, passwords ...
Secrets can be protected with RBAC
(e.g. "you can write secrets, but only the app's service account can read them")
Sealed Secrets is an operator that lets us store secrets in code repositories
It uses asymetric cryptography:
anyone can encrypt a secret
only the cluster can decrypt a secret
Principle
The Sealed Secrets operator uses a public and a private key
The public key is available publicly (duh!)
We use the public key to encrypt secrets into a SealedSecret resource
the SealedSecret resource can be stored in a code repo (even a public one)
The SealedSecret resource is
kubectl apply'd to the clusterThe Sealed Secrets controller decrypts the SealedSecret with the private key
(this creates a classic Secret resource)
Nobody else can decrypt secrets, since only the controller has the private key
In action
We will install the Sealed Secrets operator
We will generate a Secret
We will "seal" that Secret (generate a SealedSecret)
We will load that SealedSecret on the cluster
We will check that we now have a Secret
Installing the operator
The official installation is done through a single YAML file
There is also a Helm chart if you prefer that
- Install the operator:kubectl apply -f \https://github.com/bitnami-labs/sealed-secrets/releases/download/v0.13.1/controller.yaml
Note: it installs into kube-system by default.
If you change that, you will also need to inform kubeseal later on.
Creating a Secret
- Let's create a normal (unencrypted) secret
- Create a Secret with a couple of API tokens:kubectl create secret generic awskey \--from-literal=AWS_ACCESS_KEY_ID=AKI... \--from-literal=AWS_SECRET_ACCESS_KEY=abc123xyz... \--dry-run=client -o yaml > secret-aws.yaml
Note the
--dry-runand-o yaml(we're just generating YAML, not sending the secrets to our Kubernetes cluster)
We could also write the YAML from scratch or generate it with other tools
Creating a Sealed Secret
This is done with the
kubesealtoolIt will obtain the public key from the cluster
- Create the Sealed Secret:kubeseal < secret-aws.yaml > sealed-secret-aws.json
The file
sealed-secret-aws.jsoncan be committed to your public repo(if you prefer YAML output, you can add
-o yaml)
Using a Sealed Secret
Now let's
kubectl applythat Sealed Secret to the clusterThe Sealed Secret controller will "unseal" it for us
Check that our Secret doesn't exist (yet):
kubectl get secretsLoad the Sealed Secret into the cluster:
kubectl create -f sealed-secret-aws.jsonCheck that the secret is now available:
kubectl get secrets
Tweaking secrets
Let's see what happens if we try to rename the Secret
(or use it in a different namespace)
Delete both the Secret and the SealedSecret
Edit
sealed-secret-aws.jsonChange the name of the secret, or its namespace
(both in the SealedSecret metadata and in the Secret template)
kubectl apply -fthe new JSON file and observe the results 🤔
Sealed Secrets are scoped
A SealedSecret cannot be renamed or moved to another namespace
(at least, not by default!)
Otherwise, it would allow to evade RBAC rules:
if I can view Secrets in namespace
myappbut not in namespaceyourappI could take a SealedSecret belonging to namespace
yourapp... and deploy it in
myapp... and view the resulting decrypted Secret!
This can be changed with
--scope namespace-wideor--scope cluster-wide
Working offline
We can obtain the public key from the server
(technically, as a PEM certificate)
Then we can use that public key offline
(without contacting the server)
Relevant commands:
kubeseal --fetch-cert > seal.pemkubeseal --cert seal.pem < secret.yaml > sealedsecret.json
Key rotation
The controller generate new keys every month by default
The keys are kept as TLS Secrets in the
kube-systemnamespace(named
sealed-secrets-keyXXXXX)When keys are "rotated", old decryption keys are kept
(otherwise we can't decrypt previously-generated SealedSecrets)
Key compromise
If the sealing key (obtained with
--fetch-certis compromised):we don't need to do anything (it's a public key!)
However, if the unsealing key (the TLS secret in
kube-system) is compromised ...we need to:
rotate the key
rotate the SealedSecrets that were encrypted with that key
(as they are compromised)
Rotating the key
By default, new keys are generated every 30 days
To force the generation of a new key "right now":
obtain an RFC1123 timestamp with
date -Redit Deployment
sealed-secrets-controller(inkube-system)add
--key-cutoff-time=TIMESTAMPto the command-line
Then, rotate the SealedSecrets that were encrypted with it
(generate new Secrets, then encrypt them with the new key)
Discussion (the good)
The footprint of the operator is rather small:
only one CRD
one Deployment, one Service
a few RBAC-related objects
Discussion (the less good)
Events could be improved
no key to decrypt secretwhen there is a name/namespace mismatchno event indicating that a SealedSecret was successfully unsealed
Key rotation could be improved (how to find secrets corresponding to a key?)
If the sealing keys are lost, it's impossible to unseal the SealedSecrets
(e.g. cluster reinstall)
... Which means that we need to back up the sealing keys
... Which means that we need to be super careful with these backups!
:EN:- The Sealed Secrets Operator :FR:- L'opérateur Sealed Secrets k8s/sealed-secrets.md
Policy Management with Kyverno
(automatically generated title slide)
Policy Management with Kyverno
The Kubernetes permission management system is very flexible ...
... But it can't express everything!
Examples:
forbid using
:latestimage tagenforce that each Deployment, Service, etc. has an
ownerlabel
(except in e.g.kube-system)enforce that each container has at least a
readinessProbehealthcheck
How can we address that, and express these more complex policies?
Admission control
The Kubernetes API server provides a generic mechanism called admission control
Admission controllers will examine each write request, and can:
approve/deny it (for validating admission controllers)
additionally update the object (for mutating admission controllers)
These admission controllers can be:
plug-ins built into the Kubernetes API server
(selectively enabled/disabled by e.g. command-line flags)webhooks registered dynamically with the Kubernetes API server
What's Kyverno?
Policy management solution for Kubernetes
Open source (https://github.com/kyverno/kyverno/)
Compatible with all clusters
(doesn't require to reconfigure the control plane, enable feature gates...)
We don't endorse / support it in a particular way, but we think it's cool
It's not the only solution!
(see e.g. Open Policy Agent)
What can Kyverno do?
Validate resource manifests
(accept/deny depending on whether they conform to our policies)
Mutate resources when they get created or updated
(to add/remove/change fields on the fly)
Generate additional resources when a resource gets created
(e.g. when namespace is created, automatically add quotas and limits)
Audit existing resources
(warn about resources that violate certain policies)
How does it do it?
Kyverno is implemented as a controller or operator
It typically runs as a Deployment on our cluster
Policies are defined as custom resource definitions
They are implemented with a set of dynamic admission control webhooks
How does it do it?
Kyverno is implemented as a controller or operator
It typically runs as a Deployment on our cluster
Policies are defined as custom resource definitions
They are implemented with a set of dynamic admission control webhooks
🤔
How does it do it?
Kyverno is implemented as a controller or operator
It typically runs as a Deployment on our cluster
Policies are defined as custom resource definitions
They are implemented with a set of dynamic admission control webhooks
🤔
- Let's unpack that!
Custom resource definitions
When we install Kyverno, it will register new resource types:
Policy and ClusterPolicy (per-namespace and cluster-scope policies)
PolicyViolation and ClusterPolicyViolation (used in audit mode)
GenerateRequest (used internally when generating resources asynchronously)
We will be able to do e.g.
kubectl get policyviolations --all-namespaces(to see policy violations across all namespaces)
Policies will be defined in YAML and registered/updated with e.g.
kubectl apply
Dynamic admission control webhooks
When we install Kyverno, it will register a few webhooks for its use
(by creating ValidatingWebhookConfiguration and MutatingWebhookConfiguration resources)
All subsequent resource modifications are submitted to these webhooks
(creations, updates, deletions)
Controller
When we install Kyverno, it creates a Deployment (and therefore, a Pod)
That Pod runs the server used by the webhooks
It also runs a controller that will:
run optional checks in the background (and generate PolicyViolation objects)
process GenerateRequest objects asynchronously
Kyverno in action
We're going to install Kyverno on our cluster
Then, we will use it to implement a few policies
Kyverno versions
We're going to use version 1.2
Version 1.3.0-rc came out in November 2020
It introduces a few changes
(e.g. PolicyViolations are now PolicyReports)
Expect this to change in the near future!
Installing Kyverno
Kyverno can be installed with a (big) YAML manifest
... or with Helm charts (which allows to customize a few things)
- Install Kyverno:kubectl apply -f https://raw.githubusercontent.com/kyverno/kyverno\/v1.2.1/definitions/release/install.yaml
Kyverno policies in a nutshell
Which resources does it select?
can specify resources to match and/or exclude
can specify kinds and/or selector and/or users/roles doing the action
Which operation should be done?
- validate, mutate, or generate
For validation, whether it should enforce or audit failures
Operation details (what exactly to validate, mutate, or generate)
Immutable primary colors, take 1
Our pods can have an optional
colorlabelIf the label exists, it must be
red,green, orblueOne possible approach:
match all pods that have a
colorlabel that is notred,green, orbluedeny these pods
We could also match all pods, then deny with a condition
Testing without the policy
First, let's create a pod with an "invalid" label
(while we still can!)
We will use this later
Create a pod:
kubectl run test-color-0 --image=nginxApply a color label:
kubectl label pod test-color-0 color=purple
Our first Kyverno policy
apiVersion: kyverno.io/v1kind: ClusterPolicymetadata: name: pod-color-policy-1spec: validationFailureAction: enforce rules: - name: ensure-pod-color-is-valid match: resources: kinds: - Pod selector: matchExpressions: - key: color operator: Exists - key: color operator: NotIn values: [ red, green, blue ] validate: message: "If it exists, the label color must be red, green, or blue." deny: {}Load and try the policy
Load the policy:
kubectl apply -f ~/container.training/k8s/kyverno-pod-color-1.yamlCreate a pod:
kubectl run test-color-1 --image=nginxTry to apply a few color labels:
kubectl label pod test-color-1 color=purplekubectl label pod test-color-1 color=redkubectl label pod test-color-1 color-
Immutable primary colors, take 2
New rule: once a
colorlabel has been added, it cannot be changed(i.e. if
color=red, we can't change it tocolor=blue)Our approach:
match all pods
deny these pods if their
colorlabel has changed
"Old" and "new" versions of the pod can be referenced through
{{ request.oldObject }}and{{ request.object }}Our label is available through
{{ request.object.metadata.labels.color }}Again, other approaches are possible!
Our second Kyverno policy
apiVersion: kyverno.io/v1kind: ClusterPolicymetadata: name: pod-color-policy-2spec: validationFailureAction: enforce background: false rules: - name: prevent-color-change match: resources: kinds: - Pod validate: message: "Once label color has been added, it cannot be changed." deny: conditions: - key: "{{ request.oldObject.metadata.labels.color }}" operator: NotEqual value: "{{ request.object.metadata.labels.color }}"Load and try the policy
Load the policy:
kubectl apply -f ~/container.training/k8s/kyverno-pod-color-2.yamlCreate a pod:
kubectl run test-color-2 --image=nginxTry to apply a few color labels:
kubectl label pod test-color-2 color=purplekubectl label pod test-color-2 color=redkubectl label pod test-color-2 color=blue --overwrite
background
- What is this
background: falseoption, and why do we need it?
background
What is this
background: falseoption, and why do we need it?Admission controllers are only invoked when we change an object
Existing objects are not affected
(e.g. if we have a pod with
color=pinkbefore installing our policy)Kyvero can also run checks in the background, and report violations
(we'll see later how they are reported)
background: falsedisables that
background
What is this
background: falseoption, and why do we need it?Admission controllers are only invoked when we change an object
Existing objects are not affected
(e.g. if we have a pod with
color=pinkbefore installing our policy)Kyvero can also run checks in the background, and report violations
(we'll see later how they are reported)
background: falsedisables thatAlright, but ... why do we need it?
Accessing AdmissionRequest context
In this specific policy, we want to prevent an update
(as opposed to a mere create operation)
We want to compare the old and new version
(to check if a specific label was removed)
The
AdmissionRequestobject hasobjectandoldObjectfields(the
AdmissionRequestobject is the thing that gets submitted to the webhook)Kyverno lets us access the
AdmissionRequestobject(and in particular,
{{ request.object }}and{{ request.oldObject }})
Accessing AdmissionRequest context
In this specific policy, we want to prevent an update
(as opposed to a mere create operation)
We want to compare the old and new version
(to check if a specific label was removed)
The
AdmissionRequestobject hasobjectandoldObjectfields(the
AdmissionRequestobject is the thing that gets submitted to the webhook)Kyverno lets us access the
AdmissionRequestobject(and in particular,
{{ request.object }}and{{ request.oldObject }})Alright, but ... what's the link with
background: false?
{{ request }}
The
{{ request }}context is only available when there is anAdmissionRequestWhen a resource is "at rest", there is no
{{ request }}(and no old/new)Therefore, a policy that uses
{{ request }}cannot validate existing objects(it can only be used when an object is actually created/updated/deleted)
Immutable primary colors, take 3
New rule: once a
colorlabel has been added, it cannot be removedOur approach:
match all pods that do not have a
colorlabeldeny these pods if they had a
colorlabel before"before" can be referenced through
{{ request.oldObject }}
Again, other approaches are possible!
Our third Kyverno policy
apiVersion: kyverno.io/v1kind: ClusterPolicymetadata: name: pod-color-policy-3spec: validationFailureAction: enforce background: false rules: - name: prevent-color-removal match: resources: kinds: - Pod selector: matchExpressions: - key: color operator: DoesNotExist validate: message: "Once label color has been added, it cannot be removed." deny: conditions: - key: "{{ request.oldObject.metadata.labels.color }}" operator: NotIn value: []Load and try the policy
Load the policy:
kubectl apply -f ~/container.training/k8s/kyverno-pod-color-3.yamlCreate a pod:
kubectl run test-color-3 --image=nginxTry to apply a few color labels:
kubectl label pod test-color-3 color=purplekubectl label pod test-color-3 color=redkubectl label pod test-color-3 color-
Background checks
What about the
test-color-0pod that we create initially?(remember: we did set
color=purple)Kyverno generated a ClusterPolicyViolation to indicate it
Check that the pod still an "invalid" color:
kubectl get pods -L colorList ClusterPolicyViolations:
kubectl get clusterpolicyviolationskubectl get cpolv
Generating objects
When we create a Namespace, we also want to automatically create:
a LimitRange (to set default CPU and RAM requests and limits)
a ResourceQuota (to limit the resources used by the namespace)
a NetworkPolicy (to isolate the namespace)
We can do that with a Kyverno policy with a generate action
(it is mutually exclusive with the validate action)
Overview
The generate action must specify:
the
kindof resource to generatethe
nameof the resource to generateits
namespace, when applicableeither a
datastructure, to be used to populate the resourceor a
clonereference, to copy an existing resource
Note: the apiVersion field appears to be optional.
In practice
We will use the policy k8s/kyverno-namespace-setup.yaml
We need to generate 3 resources, so we have 3 rules in the policy
Excerpt:
generate:kind: LimitRangename: default-limitrangenamespace: "{{request.object.metadata.name}}"data:spec:limits:Note that we have to specify the
namespace(and we infer it from the name of the resource being created, i.e. the Namespace)
Lifecycle
After generated objects have been created, we can change them
(Kyverno won't update them)
Except if we use
clonetogether with thesynchronizeflag(in that case, Kyverno will watch the cloned resource)
This is convenient for e.g. ConfigMaps shared between Namespaces
Objects are generated only at creation (not when updating an old object)
Asynchronous creation
Kyverno creates resources asynchronously
(by creating a GenerateRequest resource first)
This is useful when the resource cannot be created
(because of permissions or dependency issues)
Kyverno will periodically loop through the pending GenerateRequests
Once the ressource is created, the GenerateRequest is marked as Completed
Footprint
5 CRDs: 4 user-facing, 1 internal (GenerateRequest)
5 webhooks
1 Service, 1 Deployment, 1 ConfigMap
Internal resources (GenerateRequest) "parked" in a Namespace
Kyverno packs a lot of features in a small footprint
Strengths
Kyverno is very easy to install
(it's harder to get easier than one
kubectl apply -f)The setup of the webhooks is fully automated
(including certificate generation)
It offers both namespaced and cluster-scope policies
(same thing for the policy violations)
The policy language leverages existing constructs
(e.g.
matchExpressions)
Caveats
By default, the webhook failure policy is
Ignore(meaning that there is a potential to evade policies if we can DOS the webhook)
Advanced policies (with conditionals) have unique, exotic syntax:
spec:=(volumes):=(hostPath):path: "!/var/run/docker.sock"The
{{ request }}context is powerful, but difficult to validate(Kyverno can't know ahead of time how it will be populated)
Policy validation is difficult
Pods created by controllers
When e.g. a ReplicaSet or DaemonSet creates a pod, it "owns" it
(the ReplicaSet or DaemonSet is listed in the Pod's
.metadata.ownerReferences)Kyverno treats these Pods differently
If my understanding of the code is correct (big if):
it skips validation for "owned" Pods
instead, it validates their controllers
this way, Kyverno can report errors on the controller instead of the pod
This can be a bit confusing when testing policies on such pods!
:EN:- Policy Management with Kyverno :FR:- Gestion de policies avec Kyverno
An ElasticSearch Operator
(automatically generated title slide)
An ElasticSearch Operator
We will install Elastic Cloud on Kubernetes, an ElasticSearch operator
This operator requires PersistentVolumes
We will install Rancher's local path storage provisioner to automatically create these
Then, we will create an ElasticSearch resource
The operator will detect that resource and provision the cluster
We will integrate that ElasticSearch cluster with other resources
(Kibana, Filebeat, Cerebro ...)
Installing a Persistent Volume provisioner
(This step can be skipped if you already have a dynamic volume provisioner.)
This provisioner creates Persistent Volumes backed by
hostPath(local directories on our nodes)
It doesn't require anything special ...
... But losing a node = losing the volumes on that node!
- Install the local path storage provisioner:kubectl apply -f ~/container.training/k8s/local-path-storage.yaml
Making sure we have a default StorageClass
The ElasticSearch operator will create StatefulSets
These StatefulSets will instantiate PersistentVolumeClaims
These PVCs need to be explicitly associated with a StorageClass
Or we need to tag a StorageClass to be used as the default one
- List StorageClasses:kubectl get storageclasses
We should see the local-path StorageClass.
Setting a default StorageClass
This is done by adding an annotation to the StorageClass:
storageclass.kubernetes.io/is-default-class: true
Tag the StorageClass so that it's the default one:
kubectl annotate storageclass local-path \storageclass.kubernetes.io/is-default-class=trueCheck the result:
kubectl get storageclasses
Now, the StorageClass should have (default) next to its name.
Install the ElasticSearch operator
The operator provides:
- a few CustomResourceDefinitions
- a Namespace for its other resources
- a ValidatingWebhookConfiguration for type checking
- a StatefulSet for its controller and webhook code
- a ServiceAccount, ClusterRole, ClusterRoleBinding for permissions
All these resources are grouped in a convenient YAML file
- Install the operator:kubectl apply -f ~/container.training/k8s/eck-operator.yaml
Check our new custom resources
- Let's see which CRDs were created
- List all CRDs:kubectl get crds
This operator supports ElasticSearch, but also Kibana and APM. Cool!
Create the eck-demo namespace
For clarity, we will create everything in a new namespace,
eck-demoThis namespace is hard-coded in the YAML files that we are going to use
We need to create that namespace
Create the
eck-demonamespace:kubectl create namespace eck-demoSwitch to that namespace:
kns eck-demo
Can we use a different namespace?
Yes, but then we need to update all the YAML manifests that we are going to apply in the next slides.
The eck-demo namespace is hard-coded in these YAML manifests.
Why?
Because when defining a ClusterRoleBinding that references a ServiceAccount, we have to indicate in which namespace the ServiceAccount is located.
Create an ElasticSearch resource
We can now create a resource with
kind: ElasticSearchThe YAML for that resource will specify all the desired parameters:
- how many nodes we want
- image to use
- add-ons (kibana, cerebro, ...)
- whether to use TLS or not
- etc.
- Create our ElasticSearch cluster:kubectl apply -f ~/container.training/k8s/eck-elasticsearch.yaml
Operator in action
Over the next minutes, the operator will create our ES cluster
It will report our cluster status through the CRD
- Check the logs of the operator:stern --namespace=elastic-system operator
- Watch the status of the cluster through the CRD:kubectl get es -w
Connecting to our cluster
It's not easy to use the ElasticSearch API from the shell
But let's check at least if ElasticSearch is up!
Get the ClusterIP of our ES instance:
kubectl get servicesIssue a request with
curl:curl http://CLUSTERIP:9200
We get an authentication error. Our cluster is protected!
Obtaining the credentials
The operator creates a user named
elasticIt generates a random password and stores it in a Secret
Extract the password:
kubectl get secret demo-es-elastic-user \-o go-template="{{ .data.elastic | base64decode }} "Use it to connect to the API:
curl -u elastic:PASSWORD http://CLUSTERIP:9200
We should see a JSON payload with the "You Know, for Search" tagline.
Sending data to the cluster
Let's send some data to our brand new ElasticSearch cluster!
We'll deploy a filebeat DaemonSet to collect node logs
Deploy filebeat:
kubectl apply -f ~/container.training/k8s/eck-filebeat.yamlWait until some pods are up:
watch kubectl get pods -l k8s-app=filebeat
- Check that a filebeat index was created:curl -u elastic:PASSWORD http://CLUSTERIP:9200/_cat/indices
Deploying an instance of Kibana
Kibana can visualize the logs injected by filebeat
The ECK operator can also manage Kibana
Let's give it a try!
Deploy a Kibana instance:
kubectl apply -f ~/container.training/k8s/eck-kibana.yamlWait for it to be ready:
kubectl get kibana -w
Connecting to Kibana
Kibana is automatically set up to conect to ElasticSearch
(this is arranged by the YAML that we're using)
However, it will ask for authentication
It's using the same user/password as ElasticSearch
Get the NodePort allocated to Kibana:
kubectl get servicesConnect to it with a web browser
Use the same user/password as before
Setting up Kibana
After the Kibana UI loads, we need to click around a bit
Pick "explore on my own"
Click on Use Elasticsearch data / Connect to your Elasticsearch index"
Enter
filebeat-*for the index pattern and click "Next step"Select
@timestampas time filter field nameClick on "discover" (the small icon looking like a compass on the left bar)
Play around!
Scaling up the cluster
At this point, we have only one node
We are going to scale up
But first, we'll deploy Cerebro, an UI for ElasticSearch
This will let us see the state of the cluster, how indexes are sharded, etc.
Deploying Cerebro
Cerebro is stateless, so it's fairly easy to deploy
(one Deployment + one Service)
However, it needs the address and credentials for ElasticSearch
We prepared yet another manifest for that!
Deploy Cerebro:
kubectl apply -f ~/container.training/k8s/eck-cerebro.yamlLookup the NodePort number and connect to it:
kubectl get services
Scaling up the cluster
We can see on Cerebro that the cluster is "yellow"
(because our index is not replicated)
Let's change that!
Edit the ElasticSearch cluster manifest:
kubectl edit es demoFind the field
count: 1and change it to 3Save and quit
:EN:- Deploying ElasticSearch with ECK :FR:- Déployer ElasticSearch avec ECK
Finalizers
(automatically generated title slide)
Finalizers
Sometimes, we¹ want to prevent a resource from being deleted:
perhaps it's "precious" (holds important data)
perhaps other resources depend on it (and should be deleted first)
perhaps we need to perform some clean up before it's deleted
Finalizers are a way to do that!
¹The "we" in that sentence generally stands for a controller.
(We can also use finalizers directly ourselves, but it's not very common.)
Examples
Prevent deletion of a PersistentVolumeClaim which is used by a Pod
Prevent deletion of a PersistentVolume which is bound to a PersistentVolumeClaim
Prevent deletion of a Namespace that still contains objects
When a LoadBalancer Service is deleted, make sure that the corresponding external resource (e.g. NLB, GLB, etc.) gets deleted¹
When a CRD gets deleted, make sure that all the associated resources get deleted²
¹²Finalizers are not the only solution for these use-cases.
How do they work?
Each resource can have list of
finalizersin itsmetadata, e.g.:kind: PersistentVolumeClaimapiVersion: v1metadata:name: my-pvcannotations: ...finalizers:- kubernetes.io/pvc-protectionIf we try to delete an resource that has at least one finalizer:
the resource is not deleted
instead, its
deletionTimestampis set to the current timewe are merely marking the resource for deletion
What happens next?
The controller that added the finalizer is supposed to:
watch for resources with a
deletionTimestampexecute necessary clean-up actions
then remove the finalizer
The resource is deleted once all the finalizers have been removed
(there is no timeout, so this could take forever)
Until then, the resource can be used normally
(but no further finalizer can be added to the resource)
Finalizers in review
Let's review the examples mentioned earlier.
For each of them, we'll see if there are other (perhaps better) options.
Volume finalizer
Kubernetes applies the following finalizers:
kubernetes.io/pvc-protectionon PersistentVolumeClaimskubernetes.io/pv-protectionon PersistentVolumes
This prevents removing them when they are in use
Implementation detail: the finalizer is present even when the resource is not in use
When the resource is
deletedmarked for deletion, the controller will check if the finalizer can be removed(Perhaps to avoid race conditions?)
Namespace finalizer
Kubernetes applies a finalizer named
kubernetesIt prevents removing the namespace if it still contains objects
Can we remove the namespace anyway?
remove the finalizer
delete the namespace
force deletion
It seems to works but, in fact, the objects in the namespace still exist
(and they will re-appear if we re-create the namespace)
See this blog post for more details about this.
LoadBalancer finalizer
Scenario:
We run a custom controller to implement provisioning of LoadBalancer Services.
When a Service with type=LoadBalancer is deleted, we want to make sure that the corresponding external resources are properly deleted.
Rationale for using a finalizer:
Normally, we would watch and observe the deletion of the Service; but if the Service is deleted while our controller is down, we could "miss" the deletion and forget to clean up the external resource.
The finalizer ensures that we will "see" the deletion and clean up the external resource.
Counterpoint
We could also:
Tag the external resources
(to indicate which Kubernetes Service they correspond to)Periodically reconcile them against Kubernetes resources
If a Kubernetes resource does no longer exist, delete the external resource
This doesn't have to be a pre-delete hook
(unless we store important information in the Service, e.g. as annotations)
CRD finalizer
Scenario:
We have a CRD that represents a PostgreSQL cluster.
It provisions StatefulSets, Deployments, Services, Secrets, ConfigMaps.
When the CRD is deleted, we want to delete all these resources.
Rationale for using a finalizer:
Same as previously; we could observe the CRD, but if it is deleted while the controller isn't running, we would miss the deletion, and the other resources would keep running.
Counterpoint
We could use the same technique as described before
(tag the resources with e.g. annotations, to associate them with the CRD)
Even better: we could use
ownerReferences(this feature is specifically designed for that use-case!)
CRD finalizer (take two)
Scenario:
We have a CRD that represents a PostgreSQL cluster.
It provisions StatefulSets, Deployments, Services, Secrets, ConfigMaps.
When the CRD is deleted, we want to delete all these resources.
We also want to store a final backup of the database.
We also want to update final usage metrics (e.g. for billing purposes).
Rationale for using a finalizer:
We need to take some actions before the resources get deleted, not after.
Wrapping up
Finalizers are a great way to:
prevent deletion of a resource that is still in use
have a "guaranteed" pre-delete hook
They can also be (ab)used for other purposes
Code spelunking exercise:
check where finalizers are used in the Kubernetes code base and why!
:EN:- Using "finalizers" to manage resource lifecycle :FR:- Gérer le cycle de vie des ressources avec les finalizers
Owners and dependents
(automatically generated title slide)
Owners and dependents
Some objects are created by other objects
(example: pods created by replica sets, themselves created by deployments)
When an owner object is deleted, its dependents are deleted
(this is the default behavior; it can be changed)
We can delete a dependent directly if we want
(but generally, the owner will recreate another right away)
An object can have multiple owners
Finding out the owners of an object
- The owners are recorded in the field
ownerReferencesin themetadatablock
Let's create a deployment running
nginx:kubectl create deployment yanginx --image=nginxScale it to a few replicas:
kubectl scale deployment yanginx --replicas=3Once it's up, check the corresponding pods:
kubectl get pods -l app=yanginx -o yaml | head -n 25
These pods are owned by a ReplicaSet named yanginx-xxxxxxxxxx.
Listing objects with their owners
- This is a good opportunity to try the
custom-columnsoutput!
- Show all pods with their owners:kubectl get pod -o custom-columns=\NAME:.metadata.name,\OWNER-KIND:.metadata.ownerReferences[0].kind,\OWNER-NAME:.metadata.ownerReferences[0].name
Note: the custom-columns option should be one long option (without spaces),
so the lines should not be indented (otherwise the indentation will insert spaces).
Deletion policy
When deleting an object through the API, three policies are available:
foreground (API call returns after all dependents are deleted)
background (API call returns immediately; dependents are scheduled for deletion)
orphan (the dependents are not deleted)
When deleting an object with
kubectl, this is selected with--cascade:--cascade=truedeletes all dependent objects (default)--cascade=falseorphans dependent objects
What happens when an object is deleted
It is removed from the list of owners of its dependents
If, for one of these dependents, the list of owners becomes empty ...
if the policy is "orphan", the object stays
otherwise, the object is deleted
Orphaning pods
We are going to delete the Deployment and Replica Set that we created
... without deleting the corresponding pods!
Delete the Deployment:
kubectl delete deployment -l app=yanginx --cascade=falseDelete the Replica Set:
kubectl delete replicaset -l app=yanginx --cascade=falseCheck that the pods are still here:
kubectl get pods
When and why would we have orphans?
If we remove an owner and explicitly instruct the API to orphan dependents
(like on the previous slide)
If we change the labels on a dependent, so that it's not selected anymore
(e.g. change the
app: yanginxin the pods of the previous example)If a deployment tool that we're using does these things for us
If there is a serious problem within API machinery or other components
(i.e. "this should not happen")
Finding orphan objects
We're going to output all pods in JSON format
Then we will use
jqto keep only the ones without an ownerAnd we will display their name
- List all pods that do not have an owner:kubectl get pod -o json | jq -r ".items[]| select(.metadata.ownerReferences|not)| .metadata.name"
Deleting orphan pods
- Now that we can list orphan pods, deleting them is easy
- Add
| xargs kubectl delete podto the previous command:kubectl get pod -o json | jq -r ".items[]| select(.metadata.ownerReferences|not)| .metadata.name" | xargs kubectl delete pod
As always, the documentation has useful extra information and pointers.
:EN:- Owners and dependents :FR:- Liens de parenté entre les ressources
Events
(automatically generated title slide)
Events
Kubernetes has an internal structured log of events
These events are ordinary resources:
we can view them with
kubectl get eventsthey can be viewed and created through the Kubernetes API
they are stored in Kubernetes default database (e.g. etcd)
Most components will generate events to let us know what's going on
Events can be related to other resources
Reading events
kubectl get events(orkubectl get ev)Can use
--watch⚠️ Looks like
tail -f, but events aren't necessarily sorted!Can use
--all-namespacesCluster events (e.g. related to nodes) are in the
defaultnamespaceViewing all "non-normal" events:
kubectl get ev -A --field-selector=type!=Normal(as of Kubernetes 1.19,
typecan be eitherNormalorWarning)
Reading events (take 2)
- When we use
kubectl describeon an object,kubectlretrieves the associated events
- See the API requests happening when we use
kubectl describe:kubectl describe service kubernetes --namespace=default -v6 >/dev/null
Generating events
This is rarely (if ever) done manually
(i.e. by crafting some YAML)
But controllers (e.g. operators) need this!
It's not mandatory, but it helps with operability
(e.g. when we
kubectl describea CRD, we will see associated events)
⚠️ Work in progress
"Events" can be :
"old-style" events (in core API group, aka
v1)"new-style" events (in API group
events.k8s.io)
See KEP 383 in particular this comparison between old and new APIs
Experimenting with events
- Let's create an event related to a Node, based on k8s/event-node.yaml
Edit
k8s/event-node.yamlUpdate the
nameanduidof theinvolvedObjectCreate the event with
kubectl create -fLook at the Node with
kubectl describe
Experimenting with events
- Let's create an event related to a Pod, based on k8s/event-pod.yaml
Create a pod
Edit
k8s/event-pod.yamlEdit the
involvedObjectsection (don't forget theuid)Create the event with
kubectl create -fLook at the Pod with
kubectl describe
Generating events in practice
In Go, use an
EventRecorderprovided by thekubernetes/client-golibraryIt will take care of formatting / aggregating events
To get an idea of what to put in the
reasonfield, check kubelet events
Cluster operator perspective
Events are kept 1 hour by default
This can be changed with the
--event-ttlflag on the API serverOn very busy clusters, events can be kept on a separate etcd cluster
This is done with the
--etcd-servers-overridesflag on the API serverExample:
--etcd-servers-overrides=/events#http://127.0.0.1:12379
:EN:- Consuming and generating cluster events :FR:- Suivre l'activité du cluster avec les events
Building our own cluster
(automatically generated title slide)
Building our own cluster
Let's build our own cluster!
Perfection is attained not when there is nothing left to add, but when there is nothing left to take away. (Antoine de Saint-Exupery)
Our goal is to build a minimal cluster allowing us to:
- create a Deployment (with
kubectl create deployment) - expose it with a Service
- connect to that service
- create a Deployment (with
"Minimal" here means:
- smaller number of components
- smaller number of command-line flags
- smaller number of configuration files
Non-goals
For now, we don't care about security
For now, we don't care about scalability
For now, we don't care about high availability
All we care about is simplicity
Our environment
We will use the machine indicated as
dmuc1(this stands for "Dessine Moi Un Cluster" or "Draw Me A Sheep",
in homage to Saint-Exupery's "The Little Prince")This machine:
runs Ubuntu LTS
has Kubernetes, Docker, and etcd binaries installed
but nothing is running
Checking our environment
- Let's make sure we have everything we need first
Log into the
dmuc1machineGet root:
sudo -iCheck available versions:
etcd -versionkube-apiserver --versiondockerd --version
The plan
Start API server
Interact with it (create Deployment and Service)
See what's broken
Fix it and go back to step 2 until it works!
Dealing with multiple processes
We are going to start many processes
Depending on what you're comfortable with, you can:
open multiple windows and multiple SSH connections
use a terminal multiplexer like screen or tmux
put processes in the background with
&
(warning: log output might get confusing to read!)
Starting API server
- Try to start the API server:kube-apiserver# It will fail with "--etcd-servers must be specified"
Since the API server stores everything in etcd, it cannot start without it.
Starting etcd
- Try to start etcd:etcd
Success!
Note the last line of output:
serving insecure client requests on 127.0.0.1:2379, this is strongly discouraged!Sure, that's discouraged. But thanks for telling us the address!
Starting API server (for real)
Try again, passing the
--etcd-serversargumentThat argument should be a comma-separated list of URLs
- Start API server:kube-apiserver --etcd-servers http://127.0.0.1:2379
Success!
Interacting with API server
- Let's try a few "classic" commands
List nodes:
kubectl get nodesList services:
kubectl get services
We should get No resources found. and the kubernetes service, respectively.
Note: the API server automatically created the kubernetes service entry.
What about kubeconfig?
We didn't need to create a
kubeconfigfileBy default, the API server is listening on
localhost:8080(without requiring authentication)
By default,
kubectlconnects tolocalhost:8080(without providing authentication)
Creating a Deployment
- Let's run a web server!
- Create a Deployment with NGINX:kubectl create deployment web --image=nginx
Success?
Checking our Deployment status
- Look at pods, deployments, etc.:kubectl get all
Our Deployment is in bad shape:
NAME READY UP-TO-DATE AVAILABLE AGEdeployment.apps/web 0/1 0 0 2m26sAnd, there is no ReplicaSet, and no Pod.
What's going on?
We stored the definition of our Deployment in etcd
(through the API server)
But there is no controller to do the rest of the work
We need to start the controller manager
Starting the controller manager
- Try to start the controller manager:kube-controller-manager
The final error message is:
invalid configuration: no configuration has been providedBut the logs include another useful piece of information:
Neither --kubeconfig nor --master was specified.Using the inClusterConfig. This might not work.Reminder: everyone talks to API server
The controller manager needs to connect to the API server
It does not have a convenient
localhost:8080defaultWe can pass the connection information in two ways:
--masterand a host:port combination (easy)--kubeconfigand akubeconfigfile
For simplicity, we'll use the first option
Starting the controller manager (for real)
- Start the controller manager:kube-controller-manager --master http://localhost:8080
Success!
Checking our Deployment status
- Check all our resources again:kubectl get all
We now have a ReplicaSet.
But we still don't have a Pod.
What's going on?
In the controller manager logs, we should see something like this:
E0404 15:46:25.753376 22847 replica_set.go:450] Sync "default/web-5bc9bd5b8d"failed with No API token found for service account "default", retry after thetoken is automatically created and added to the service accountThe service account
defaultwas automatically added to our Deployment(and to its pods)
The service account
defaultexistsBut it doesn't have an associated token
(the token is a secret; creating it requires signature; therefore a CA)
Solving the missing token issue
There are many ways to solve that issue.
We are going to list a few (to get an idea of what's happening behind the scenes).
Of course, we don't need to perform all the solutions mentioned here.
Option 1: disable service accounts
Restart the API server with
--disable-admission-plugins=ServiceAccountThe API server will no longer add a service account automatically
Our pods will be created without a service account
Option 2: do not mount the (missing) token
Add
automountServiceAccountToken: falseto the Deployment specor
Add
automountServiceAccountToken: falseto the default ServiceAccountThe ReplicaSet controller will no longer create pods referencing the (missing) token
- Programmatically change the
defaultServiceAccount:kubectl patch sa default -p "automountServiceAccountToken: false"
Option 3: set up service accounts properly
This is the most complex option!
Generate a key pair
Pass the private key to the controller manager
(to generate and sign tokens)
Pass the public key to the API server
(to verify these tokens)
Continuing without service account token
- Once we patch the default service account, the ReplicaSet can create a Pod
- Check that we now have a pod:kubectl get all
Note: we might have to wait a bit for the ReplicaSet controller to retry.
If we're impatient, we can restart the controller manager.
What's next?
Our pod exists, but it is in
PendingstateRemember, we don't have a node so far
(
kubectl get nodesshows an empty list)We need to:
start a container engine
start kubelet
Starting a container engine
- We're going to use Docker (because it's the default option)
- Start the Docker Engine:dockerd
Success!
Feel free to check that it actually works with e.g.:
docker run alpine echo hello worldStarting kubelet
If we start kubelet without arguments, it will start
But it will not join the cluster!
It will start in standalone mode
Just like with the controller manager, we need to tell kubelet where the API server is
Alas, kubelet doesn't have a simple
--masteroptionWe have to use
--kubeconfigWe need to write a
kubeconfigfile for kubelet
Writing a kubeconfig file
We can copy/paste a bunch of YAML
Or we can generate the file with
kubectl
- Create the file
~/.kube/configwithkubectl:kubectl config \set-cluster localhost --server http://localhost:8080kubectl config \set-context localhost --cluster localhostkubectl config \use-context localhost
Our ~/.kube/config file
The file that we generated looks like the one below.
That one has been slightly simplified (removing extraneous fields), but it is still valid.
apiVersion: v1kind: Configcurrent-context: localhostcontexts:- name: localhost context: cluster: localhostclusters:- name: localhost cluster: server: http://localhost:8080Starting kubelet
- Start kubelet with that kubeconfig file:kubelet --kubeconfig ~/.kube/config
Success!
Looking at our 1-node cluster
- Let's check that our node registered correctly
- List the nodes in our cluster:kubectl get nodes
Our node should show up.
Its name will be its hostname (it should be dmuc1).
Are we there yet?
- Let's check if our pod is running
- List all resources:kubectl get all
Are we there yet?
- Let's check if our pod is running
- List all resources:kubectl get all
Our pod is still Pending. 🤔
Are we there yet?
- Let's check if our pod is running
- List all resources:kubectl get all
Our pod is still Pending. 🤔
Which is normal: it needs to be scheduled.
(i.e., something needs to decide which node it should go on.)
Scheduling our pod
Why do we need a scheduling decision, since we have only one node?
The node might be full, unavailable; the pod might have constraints ...
The easiest way to schedule our pod is to start the scheduler
(we could also schedule it manually)
Starting the scheduler
The scheduler also needs to know how to connect to the API server
Just like for controller manager, we can use
--kubeconfigor--master
- Start the scheduler:kube-scheduler --master http://localhost:8080
- Our pod should now start correctly
Checking the status of our pod
Our pod will go through a short
ContainerCreatingphaseThen it will be
Running
- Check pod status:kubectl get pods
Success!
Scheduling a pod manually
We can schedule a pod in
Pendingstate by creating a Binding, e.g.:kubectl create -f- <<EOFapiVersion: v1kind: Bindingmetadata:name: name-of-the-podtarget:apiVersion: v1kind: Nodename: name-of-the-nodeEOFThis is actually how the scheduler works!
It watches pods, makes scheduling decisions, and creates Binding objects
Connecting to our pod
- Let's check that our pod correctly runs NGINX
Check our pod's IP address:
kubectl get pods -o wideSend some HTTP request to the pod:
curl X.X.X.X
We should see the Welcome to nginx! page.
Exposing our Deployment
- We can now create a Service associated with this Deployment
Expose the Deployment's port 80:
kubectl expose deployment web --port=80Check the Service's ClusterIP, and try connecting:
kubectl get service webcurl http://X.X.X.X
Exposing our Deployment
- We can now create a Service associated with this Deployment
Expose the Deployment's port 80:
kubectl expose deployment web --port=80Check the Service's ClusterIP, and try connecting:
kubectl get service webcurl http://X.X.X.X
This won't work. We need kube-proxy to enable internal communication.
Starting kube-proxy
kube-proxy also needs to connect to the API server
It can work with the
--masterflag(although that will be deprecated in the future)
- Start kube-proxy:kube-proxy --master http://localhost:8080
Connecting to our Service
- Now that kube-proxy is running, we should be able to connect
- Check the Service's ClusterIP again, and retry connecting:kubectl get service webcurl http://X.X.X.X
Success!
How kube-proxy works
kube-proxy watches Service resources
When a Service is created or updated, kube-proxy creates iptables rules
Check out the
OUTPUTchain in thenattable:iptables -t nat -L OUTPUTTraffic is sent to
KUBE-SERVICES; check that too:iptables -t nat -L KUBE-SERVICES
For each Service, there is an entry in that chain.
Diving into iptables
- The last command showed a chain named
KUBE-SVC-...corresponding to our service
Check that
KUBE-SVC-...chain:iptables -t nat -L KUBE-SVC-...It should show a jump to a
KUBE-SEP-...chains; check it out too:iptables -t nat -L KUBE-SEP-...
This is a DNAT rule to rewrite the destination address of the connection to our pod.
This is how kube-proxy works!
kube-router, IPVS
With recent versions of Kubernetes, it is possible to tell kube-proxy to use IPVS
IPVS is a more powerful load balancing framework
(remember: iptables was primarily designed for firewalling, not load balancing!)
It is also possible to replace kube-proxy with kube-router
kube-router uses IPVS by default
kube-router can also perform other functions
(e.g., we can use it as a CNI plugin to provide pod connectivity)
What about the kubernetes service?
If we try to connect, it won't work
(by default, it should be
10.0.0.1)If we look at the Endpoints for this service, we will see one endpoint:
host-address:6443By default, the API server expects to be running directly on the nodes
(it could be as a bare process, or in a container/pod using the host network)
... And it expects to be listening on port 6443 with TLS
:EN:- Building our own cluster from scratch :FR:- Construire son cluster à la main
Adding nodes to the cluster
(automatically generated title slide)
Adding nodes to the cluster
So far, our cluster has only 1 node
Let's see what it takes to add more nodes
We are going to use another set of machines:
kubenet
The environment
We have 3 identical machines:
kubenet1,kubenet2,kubenet3The Docker Engine is installed (and running) on these machines
The Kubernetes binaries are installed, but nothing is running
We will use
kubenet1to run the control plane
The plan
Start the control plane on
kubenet1Join the 3 nodes to the cluster
Deploy and scale a simple web server
- Log into
kubenet1
Running the control plane
- We will use a Compose file to start the control plane components
Clone the repository containing the workshop materials:
git clone https://github.com/jpetazzo/container.trainingGo to the
compose/simple-k8s-control-planedirectory:cd container.training/compose/simple-k8s-control-planeStart the control plane:
docker-compose up
Checking the control plane status
- Before moving on, verify that the control plane works
Show control plane component statuses:
kubectl get componentstatuseskubectl get csShow the (empty) list of nodes:
kubectl get nodes
Differences from dmuc
Our new control plane listens on
0.0.0.0instead of the default127.0.0.1The ServiceAccount admission plugin is disabled
Joining the nodes
We need to generate a
kubeconfigfile for kubeletThis time, we need to put the public IP address of
kubenet1(instead of
localhostor127.0.0.1)
- Generate the
kubeconfigfile:kubectl config set-cluster kubenet --server http://X.X.X.X:8080kubectl config set-context kubenet --cluster kubenetkubectl config use-context kubenetcp ~/.kube/config ~/kubeconfig
Distributing the kubeconfig file
- We need that
kubeconfigfile on the other nodes, too
- Copy
kubeconfigto the other nodes:for N in 2 3; doscp ~/kubeconfig kubenet$N:done
Starting kubelet
- Reminder: kubelet needs to run as root; don't forget
sudo!
Join the first node:
sudo kubelet --kubeconfig ~/kubeconfigOpen more terminals and join the other nodes to the cluster:
ssh kubenet2 sudo kubelet --kubeconfig ~/kubeconfigssh kubenet3 sudo kubelet --kubeconfig ~/kubeconfig
Checking cluster status
We should now see all 3 nodes
At first, their
STATUSwill beNotReadyThey will move to
Readystate after approximately 10 seconds
- Check the list of nodes:kubectl get nodes
Deploy a web server
Let's create a Deployment and scale it
(so that we have multiple pods on multiple nodes)
Create a Deployment running NGINX:
kubectl create deployment web --image=nginxScale it:
kubectl scale deployment web --replicas=5
Check our pods
The pods will be scheduled on the nodes
The nodes will pull the
nginximage, and start the podsWhat are the IP addresses of our pods?
- Check the IP addresses of our podskubectl get pods -o wide
Check our pods
The pods will be scheduled on the nodes
The nodes will pull the
nginximage, and start the podsWhat are the IP addresses of our pods?
- Check the IP addresses of our podskubectl get pods -o wide
🤔 Something's not right ... Some pods have the same IP address!
What's going on?
Without the
--network-pluginflag, kubelet defaults to "no-op" networkingIt lets the container engine use a default network
(in that case, we end up with the default Docker bridge)
Our pods are running on independent, disconnected, host-local networks
What do we need to do?
On a normal cluster, kubelet is configured to set up pod networking with CNI plugins
This requires:
installing CNI plugins
writing CNI configuration files
running kubelet with
--network-plugin=cni
Using network plugins
We need to set up a better network
Before diving into CNI, we will use the
kubenetpluginThis plugin creates a
cbr0bridge and connects the containers to that bridgeThis plugin allocates IP addresses from a range:
either specified to kubelet (e.g. with
--pod-cidr)or stored in the node's
spec.podCIDRfield
See here for more details about this kubenet plugin.
k8s/multinode.md
What kubenet does and does not do
It allocates IP addresses to pods locally
(each node has its own local subnet)
It connects the pods to a local bridge
(pods on the same node can communicate together; not with other nodes)
It doesn't set up routing or tunneling
(we get pods on separated networks; we need to connect them somehow)
It doesn't allocate subnets to nodes
(this can be done manually, or by the controller manager)
Setting up routing or tunneling
On each node, we will add routes to the other nodes' pod network
Of course, this is not convenient or scalable!
We will see better techniques to do this; but for now, hang on!
Allocating subnets to nodes
There are multiple options:
passing the subnet to kubelet with the
--pod-cidrflagmanually setting
spec.podCIDRon each nodeallocating node CIDRs automatically with the controller manager
The last option would be implemented by adding these flags to controller manager:
--allocate-node-cidrs=true --cluster-cidr=<cidr>
The pod CIDR field is not mandatory
kubenetneeds the pod CIDR, but other plugins don't need it(e.g. because they allocate addresses in multiple pools, or a single big one)
The pod CIDR field may eventually be deprecated and replaced by an annotation
Restarting kubelet wih pod CIDR
We need to stop and restart all our kubelets
We will add the
--network-pluginand--pod-cidrflagsWe all have a "cluster number" (let's call that
C) printed on your VM info cardWe will use pod CIDR
10.C.N.0/24(whereNis the node number: 1, 2, 3)
Stop all the kubelets (Ctrl-C is fine)
Restart them all, adding
--network-plugin=kubenet --pod-cidr 10.C.N.0/24
What happens to our pods?
When we stop (or kill) kubelet, the containers keep running
When kubelet starts again, it detects the containers
- Check that our pods are still here:kubectl get pods -o wide
🤔 But our pods still use local IP addresses!
Recreating the pods
The IP address of a pod cannot change
kubelet doesn't automatically kill/restart containers with "invalid" addresses
(in fact, from kubelet's point of view, there is no such thing as an "invalid" address)We must delete our pods and recreate them
Delete all the pods, and let the ReplicaSet recreate them:
kubectl delete pods --allWait for the pods to be up again:
kubectl get pods -o wide -w
Adding kube-proxy
Let's start kube-proxy to provide internal load balancing
Then see if we can create a Service and use it to contact our pods
Start kube-proxy:
sudo kube-proxy --kubeconfig ~/.kube/configExpose our Deployment:
kubectl expose deployment web --port=80
Test internal load balancing
Retrieve the ClusterIP address:
kubectl get svc webSend a few requests to the ClusterIP address (with
curl)
Test internal load balancing
Retrieve the ClusterIP address:
kubectl get svc webSend a few requests to the ClusterIP address (with
curl)
Sometimes it works, sometimes it doesn't. Why?
Routing traffic
Our pods have new, distinct IP addresses
But they are on host-local, isolated networks
If we try to ping a pod on a different node, it won't work
kube-proxy merely rewrites the destination IP address
But we need that IP address to be reachable in the first place
How do we fix this?
(hint: check the title of this slide!)
Important warning
The technique that we are about to use doesn't work everywhere
It only works if:
all the nodes are directly connected to each other (at layer 2)
the underlying network allows the IP addresses of our pods
If we are on physical machines connected by a switch: OK
If we are on virtual machines in a public cloud: NOT OK
on AWS, we need to disable "source and destination checks" on our instances
on OpenStack, we need to disable "port security" on our network ports
Routing basics
We need to tell each node:
"The subnet 10.C.N.0/24 is located on node N" (for all values of N)
This is how we add a route on Linux:
ip route add 10.C.N.0/24 via W.X.Y.Z(where
W.X.Y.Zis the internal IP address of node N)We can see the internal IP addresses of our nodes with:
kubectl get nodes -o wide
Firewalling
By default, Docker prevents containers from using arbitrary IP addresses
(by setting up iptables rules)
We need to allow our containers to use our pod CIDR
For simplicity, we will insert a blanket iptables rule allowing all traffic:
iptables -I FORWARD -j ACCEPTThis has to be done on every node
Setting up routing
Create all the routes on all the nodes
Insert the iptables rule allowing traffic
Check that you can ping all the pods from one of the nodes
Check that you can
curlthe ClusterIP of the Service successfully
What's next?
We did a lot of manual operations:
allocating subnets to nodes
adding command-line flags to kubelet
updating the routing tables on our nodes
We want to automate all these steps
We want something that works on all networks
:EN:- Connecting nodes ands pods :FR:- Interconnecter les nœuds et les pods
The Container Network Interface
(automatically generated title slide)
The Container Network Interface
Allows us to decouple network configuration from Kubernetes
Implemented by plugins
Plugins are executables that will be invoked by kubelet
Plugins are responsible for:
allocating IP addresses for containers
configuring the network for containers
Plugins can be combined and chained when it makes sense
Combining plugins
Interface could be created by e.g.
vlanorbridgepluginIP address could be allocated by e.g.
dhcporhost-localpluginInterface parameters (MTU, sysctls) could be tweaked by the
tuningplugin
The reference plugins are available here.
Look in each plugin's directory for its documentation. k8s/cni.md
How does kubelet know which plugins to use?
The plugin (or list of plugins) is set in the CNI configuration
The CNI configuration is a single file in
/etc/cni/net.dIf there are multiple files in that directory, the first one is used
(in lexicographic order)
That path can be changed with the
--cni-conf-dirflag of kubelet
CNI configuration in practice
When we set up the "pod network" (like Calico, Weave...) it ships a CNI configuration
(and sometimes, custom CNI plugins)
Very often, that configuration (and plugins) is installed automatically
(by a DaemonSet featuring an initContainer with hostPath volumes)
Examples:
Calico CNI config and volume
kube-router CNI config and volume
Conf vs conflist
There are two slightly different configuration formats
Basic configuration format:
- holds configuration for a single plugin
- typically has a
.confname suffix - has a
typestring field in the top-most structure - examples
Configuration list format:
- can hold configuration for multiple (chained) plugins
- typically has a
.conflistname suffix - has a
pluginslist field in the top-most structure - examples
How plugins are invoked
Parameters are given through environment variables, including:
CNI_COMMAND: desired operation (ADD, DEL, CHECK, or VERSION)
CNI_CONTAINERID: container ID
CNI_NETNS: path to network namespace file
CNI_IFNAME: what the network interface should be named
The network configuration must be provided to the plugin on stdin
(this avoids race conditions that could happen by passing a file path)
In practice: kube-router
We are going to set up a new cluster
For this new cluster, we will use kube-router
kube-router will provide the "pod network"
(connectivity with pods)
kube-router will also provide internal service connectivity
(replacing kube-proxy)
How kube-router works
Very simple architecture
Does not introduce new CNI plugins
(uses the
bridgeplugin, withhost-localfor IPAM)Pod traffic is routed between nodes
(no tunnel, no new protocol)
Internal service connectivity is implemented with IPVS
Can provide pod network and/or internal service connectivity
kube-router daemon runs on every node
What kube-router does
Connect to the API server
Obtain the local node's
podCIDRInject it into the CNI configuration file
(we'll use
/etc/cni/net.d/10-kuberouter.conflist)Obtain the addresses of all nodes
Establish a full mesh BGP peering with the other nodes
Exchange routes over BGP
What's BGP?
BGP (Border Gateway Protocol) is the protocol used between internet routers
It scales pretty well (it is used to announce the 700k CIDR prefixes of the internet)
It is spoken by many hardware routers from many vendors
It also has many software implementations (Quagga, Bird, FRR...)
Experienced network folks generally know it (and appreciate it)
It also used by Calico (another popular network system for Kubernetes)
Using BGP allows us to interconnect our "pod network" with other systems
The plan
We'll work in a new cluster (named
kuberouter)We will run a simple control plane (like before)
... But this time, the controller manager will allocate
podCIDRsubnets(so that we don't have to manually assign subnets to individual nodes)
We will create a DaemonSet for kube-router
We will join nodes to the cluster
The DaemonSet will automatically start a kube-router pod on each node
Logging into the new cluster
Log into node
kuberouter1Clone the workshop repository:
git clone https://github.com/jpetazzo/container.trainingMove to this directory:
cd container.training/compose/kube-router-k8s-control-plane
Checking the CNI configuration
- By default, kubelet gets the CNI configuration from
/etc/cni/net.d
- Check the content of
/etc/cni/net.d
(On most machines, at this point, /etc/cni/net.d doesn't even exist).)
Our control plane
We will use a Compose file to start the control plane
It is similar to the one we used with the
kubenetclusterThe API server is started with
--allow-privileged(because we will start kube-router in privileged pods)
The controller manager is started with extra flags too:
--allocate-node-cidrsand--cluster-cidrWe need to edit the Compose file to set the Cluster CIDR
Starting the control plane
Our cluster CIDR will be
10.C.0.0/16(where
Cis our cluster number)
Edit the Compose file to set the Cluster CIDR:
vim docker-compose.yamlStart the control plane:
docker-compose up
The kube-router DaemonSet
In the same directory, there is a
kuberouter.yamlfileIt contains the definition for a DaemonSet and a ConfigMap
Before we load it, we also need to edit it
We need to indicate the address of the API server
(because kube-router needs to connect to it to retrieve node information)
Creating the DaemonSet
The address of the API server will be
http://A.B.C.D:8080(where
A.B.C.Dis the public address ofkuberouter1, running the control plane)
Edit the YAML file to set the API server address:
vim kuberouter.yamlCreate the DaemonSet:
kubectl create -f kuberouter.yaml
Note: the DaemonSet won't create any pods (yet) since there are no nodes (yet).
Generating the kubeconfig for kubelet
- This is similar to what we did for the
kubenetcluster
- Generate the kubeconfig file (replacing
X.X.X.Xwith the address ofkuberouter1):kubectl config set-cluster cni --server http://X.X.X.X:8080kubectl config set-context cni --cluster cnikubectl config use-context cnicp ~/.kube/config ~/kubeconfig
Distributing kubeconfig
- We need to copy that kubeconfig file to the other nodes
- Copy
kubeconfigto the other nodes:for N in 2 3; doscp ~/kubeconfig kuberouter$N:done
Starting kubelet
We don't need the
--pod-cidroption anymore(the controller manager will allocate these automatically)
We need to pass
--network-plugin=cni
Join the first node:
sudo kubelet --kubeconfig ~/kubeconfig --network-plugin=cniOpen more terminals and join the other nodes:
ssh kuberouter2 sudo kubelet --kubeconfig ~/kubeconfig --network-plugin=cnissh kuberouter3 sudo kubelet --kubeconfig ~/kubeconfig --network-plugin=cni
Checking the CNI configuration
At this point, kuberouter should have installed its CNI configuration
(in
/etc/cni/net.d)
- Check the content of
/etc/cni/net.d
There should be a file created by kuberouter
The file should contain the node's podCIDR
Setting up a test
- Let's create a Deployment and expose it with a Service
Create a Deployment running a web server:
kubectl create deployment web --image=jpetazzo/httpenvScale it so that it spans multiple nodes:
kubectl scale deployment web --replicas=5Expose it with a Service:
kubectl expose deployment web --port=8888
Checking that everything works
Get the ClusterIP address for the service:
kubectl get svc webSend a few requests there:
curl X.X.X.X:8888
Note that if you send multiple requests, they are load-balanced in a round robin manner.
This shows that we are using IPVS (vs. iptables, which picked random endpoints).
Troubleshooting
- What if we need to check that everything is working properly?
Check the IP addresses of our pods:
kubectl get pods -o wideCheck our routing table:
route -nip route
We should see the local pod CIDR connected to kube-bridge, and the other nodes' pod CIDRs having individual routes, with each node being the gateway.
More troubleshooting
We can also look at the output of the kube-router pods
(with
kubectl logs)kube-router also comes with a special shell that gives lots of useful info
(we can access it with
kubectl exec)But with the current setup of the cluster, these options may not work!
Why?
Trying kubectl logs / kubectl exec
Try to show the logs of a kube-router pod:
kubectl -n kube-system logs ds/kube-routerOr try to exec into one of the kube-router pods:
kubectl -n kube-system exec kube-router-xxxxx bash
These commands will give an error message that includes:
dial tcp: lookup kuberouterX on 127.0.0.11:53: no such hostWhat does that mean?
Internal name resolution
To execute these commands, the API server needs to connect to kubelet
By default, it creates a connection using the kubelet's name
(e.g.
http://kuberouter1:...)This requires our nodes names to be in DNS
We can change that by setting a flag on the API server:
--kubelet-preferred-address-types=InternalIP
Another way to check the logs
We can also ask the logs directly to the container engine
First, get the container ID, with
docker psor like this:CID=$(docker ps -q \--filter label=io.kubernetes.pod.namespace=kube-system \--filter label=io.kubernetes.container.name=kube-router)Then view the logs:
docker logs $CID
Other ways to distribute routing tables
We don't need kube-router and BGP to distribute routes
The list of nodes (and associated
podCIDRsubnets) is available through the APIThis shell snippet generates the commands to add all required routes on a node:
NODES=$(kubectl get nodes -o name | cut -d/ -f2)for DESTNODE in $NODES; do if [ "$DESTNODE" != "$HOSTNAME" ]; then echo $(kubectl get node $DESTNODE -o go-template=" route add -net {{.spec.podCIDR}} gw {{(index .status.addresses 0).address}}") fidoneThis could be useful for embedded platforms with very limited resources
(or lab environments for learning purposes)
:EN:- Configuring CNI plugins :FR:- Configurer des plugins CNI
CNI internals
(automatically generated title slide)
CNI internals
Kubelet looks for a CNI configuration file
(by default, in
/etc/cni/net.d)Note: if we have multiple files, the first one will be used
(in lexicographic order)
If no configuration can be found, kubelet holds off on creating containers
(except if they are using
hostNetwork)Let's see how exactly plugins are invoked!
General principle
A plugin is an executable program
It is invoked with by kubelet to set up / tear down networking for a container
It doesn't take any command-line argument
However, it uses environment variables to know what to do, which container, etc.
It reads JSON on stdin, and writes back JSON on stdout
There will generally be multiple plugins invoked in a row
(at least IPAM + network setup; possibly more)
Environment variables
CNI_COMMAND:ADD,DEL,CHECK, orVERSIONCNI_CONTAINERID: opaque identifier(container ID of the "sandbox", i.e. the container running the
pauseimage)CNI_NETNS: path to network namespace pseudo-file(e.g.
/var/run/netns/cni-0376f625-29b5-7a21-6c45-6a973b3224e5)CNI_IFNAME: interface name, usuallyeth0CNI_PATH: path(s) with plugin executables (e.g./opt/cni/bin)CNI_ARGS: "extra arguments" (see next slide)
CNI_ARGS
Extra key/value pair arguments passed by "the user"
"The user", here, is "kubelet" (or in an abstract way, "Kubernetes")
This is used to pass the pod name and namespace to the CNI plugin
Example:
IgnoreUnknown=1K8S_POD_NAMESPACE=defaultK8S_POD_NAME=web-96d5df5c8-jcn72K8S_POD_INFRA_CONTAINER_ID=016493dbff152641d334d9828dab6136c1ff...
Note that technically, it's a ;-separated list, so it really looks like this:
CNI_ARGS=IgnoreUnknown=1;K8S_POD_NAMESPACE=default;K8S_POD_NAME=web-96d...JSON in, JSON out
The plugin reads its configuration on stdin
It writes back results in JSON
(e.g. allocated address, routes, DNS...)
⚠️ "Plugin configuration" is not always the same as "CNI configuration"!
Conf vs Conflist
The CNI configuration can be a single plugin configuration
it will then contain a
typefield in the top-most structureit will be passed "as-is"
It can also be a "conflist", containing a chain of plugins
(it will then contain a
pluginsfield in the top-most structure)Plugins are then invoked in order (reverse order for
DELaction)In that case, the input of the plugin is not the whole configuration
(see details on next slide)
List of plugins
When invoking a plugin in a list, the JSON input will be:
the configuration of the plugin
augmented with
name(matching the conf listname)augmented with
prevResult(which will be the output of the previous plugin)
Conceptually, a plugin (generally the first one) will do the "main setup"
Other plugins can do tuning / refinement (firewalling, traffic shaping...)
Analyzing plugins
Let's see what goes in and out of our CNI plugins!
We will create a fake plugin that:
saves its environment and input
executes the real plugin with the saved input
saves the plugin output
passes the saved output
Our fake plugin
#!/bin/shPLUGIN=$(basename $0)cat > /tmp/cni.$$.$PLUGIN.inenv | sort > /tmp/cni.$$.$PLUGIN.envecho "PPID=$PPID, $(readlink /proc/$PPID/exe)" > /tmp/cni.$$.$PLUGIN.parent$0.real < /tmp/cni.$$.$PLUGIN.in > /tmp/cni.$$.$PLUGIN.outEXITSTATUS=$?cat /tmp/cni.$$.$PLUGIN.outexit $EXITSTATUSSave this script as /opt/cni/bin/debug and make it executable.
Substituting the fake plugin
For each plugin that we want to instrument:
rename the plugin from e.g.
ptptoptp.realsymlink
ptpto ourdebugplugin
There is no need to change the CNI configuration or restart kubelet
Create some pods and looks at the results
Create a pod
For each instrumented plugin, there will be files in
/tmp:cni.PID.pluginname.in(JSON input)cni.PID.pluginname.env(environment variables)cni.PID.pluginname.parent(parent process information)cni.PID.pluginname.out(JSON output)
❓️ What is calling our plugins?
:EN:- Deep dive into CNI internals :FR:- La Container Network Interface (CNI) en détails
API server availability
(automatically generated title slide)
API server availability
When we set up a node, we need the address of the API server:
for kubelet
for kube-proxy
sometimes for the pod network system (like kube-router)
How do we ensure the availability of that endpoint?
(what if the node running the API server goes down?)
Option 1: external load balancer
Set up an external load balancer
Point kubelet (and other components) to that load balancer
Put the node(s) running the API server behind that load balancer
Update the load balancer if/when an API server node needs to be replaced
On cloud infrastructures, some mechanisms provide automation for this
(e.g. on AWS, an Elastic Load Balancer + Auto Scaling Group)
Option 2: local load balancer
Set up a load balancer (like NGINX, HAProxy...) on each node
Configure that load balancer to send traffic to the API server node(s)
Point kubelet (and other components) to
localhostUpdate the load balancer configuration when API server nodes are updated
Updating the local load balancer config
Distribute the updated configuration (push)
Or regularly check for updates (pull)
The latter requires an external, highly available store
(it could be an object store, an HTTP server, or even DNS...)
Updates can be facilitated by a DaemonSet
(but remember that it can't be used when installing a new node!)
Option 3: DNS records
Put all the API server nodes behind a round-robin DNS
Point kubelet (and other components) to that name
Update the records when needed
Note: this option is not officially supported
(but since kubelet supports reconnection anyway, it should work)
Option 4: ....................
Many managed clusters expose a high-availability API endpoint
(and you don't have to worry about it)
You can also use HA mechanisms that you're familiar with
(e.g. virtual IPs)
Tunnels are also fine
(e.g. k3s uses a tunnel to allow each node to contact the API server)
:EN:- Ensuring API server availability :FR:- Assurer la disponibilité du serveur API
Static pods
(automatically generated title slide)
Static pods
Hosting the Kubernetes control plane on Kubernetes has advantages:
we can use Kubernetes' replication and scaling features for the control plane
we can leverage rolling updates to upgrade the control plane
However, there is a catch:
deploying on Kubernetes requires the API to be available
the API won't be available until the control plane is deployed
How can we get out of that chicken-and-egg problem?
A possible approach
Since each component of the control plane can be replicated...
We could set up the control plane outside of the cluster
Then, once the cluster is fully operational, create replicas running on the cluster
Finally, remove the replicas that are running outside of the cluster
What could possibly go wrong?
Sawing off the branch you're sitting on
What if anything goes wrong?
(During the setup or at a later point)
Worst case scenario, we might need to:
set up a new control plane (outside of the cluster)
restore a backup from the old control plane
move the new control plane to the cluster (again)
This doesn't sound like a great experience
Static pods to the rescue
Pods are started by kubelet (an agent running on every node)
To know which pods it should run, the kubelet queries the API server
The kubelet can also get a list of static pods from:
a directory containing one (or multiple) manifests, and/or
a URL (serving a manifest)
These "manifests" are basically YAML definitions
(As produced by
kubectl get pod my-little-pod -o yaml)
Static pods are dynamic
Kubelet will periodically reload the manifests
It will start/stop pods accordingly
(i.e. it is not necessary to restart the kubelet after updating the manifests)
When connected to the Kubernetes API, the kubelet will create mirror pods
Mirror pods are copies of the static pods
(so they can be seen with e.g.
kubectl get pods)
Bootstrapping a cluster with static pods
We can run control plane components with these static pods
They can start without requiring access to the API server
Once they are up and running, the API becomes available
These pods are then visible through the API
(We cannot upgrade them from the API, though)
This is how kubeadm has initialized our clusters.
Static pods vs normal pods
The API only gives us read-only access to static pods
We can
kubectl deletea static pod......But the kubelet will re-mirror it immediately
Static pods can be selected just like other pods
(So they can receive service traffic)
A service can select a mixture of static and other pods
From static pods to normal pods
Once the control plane is up and running, it can be used to create normal pods
We can then set up a copy of the control plane in normal pods
Then the static pods can be removed
The scheduler and the controller manager use leader election
(Only one is active at a time; removing an instance is seamless)
Each instance of the API server adds itself to the
kubernetesserviceEtcd will typically require more work!
From normal pods back to static pods
Alright, but what if the control plane is down and we need to fix it?
We restart it using static pods!
This can be done automatically with the Pod Checkpointer
The Pod Checkpointer automatically generates manifests of running pods
The manifests are used to restart these pods if API contact is lost
(More details in the Pod Checkpointer documentation page)
This technique is used by bootkube k8s/staticpods.md
Where should the control plane run?
Is it better to run the control plane in static pods, or normal pods?
If I'm a user of the cluster: I don't care, it makes no difference to me
What if I'm an admin, i.e. the person who installs, upgrades, repairs... the cluster?
If I'm using a managed Kubernetes cluster (AKS, EKS, GKE...) it's not my problem
(I'm not the one setting up and managing the control plane)
If I already picked a tool (kubeadm, kops...) to set up my cluster, the tool decides for me
What if I haven't picked a tool yet, or if I'm installing from scratch?
static pods = easier to set up, easier to troubleshoot, less risk of outage
normal pods = easier to upgrade, easier to move (if nodes need to be shut down)
Static pods in action
- On our clusters, the
staticPodPathis/etc/kubernetes/manifests
- Have a look at this directory:ls -l /etc/kubernetes/manifests
We should see YAML files corresponding to the pods of the control plane.
Running a static pod
- We are going to add a pod manifest to the directory, and kubelet will run it
Copy a manifest to the directory:
sudo cp ~/container.training/k8s/just-a-pod.yaml /etc/kubernetes/manifestsCheck that it's running:
kubectl get pods
The output should include a pod named hello-node1.
Remarks
In the manifest, the pod was named hello.
apiVersion: v1kind: Podmetadata: name: hello namespace: defaultspec: containers: - name: hello image: nginxThe -node1 suffix was added automatically by kubelet.
If we delete the pod (with kubectl delete), it will be recreated immediately.
To delete the pod, we need to delete (or move) the manifest file.
:EN:- Static pods :FR:- Les static pods
Upgrading clusters
(automatically generated title slide)
Upgrading clusters
It's recommended to run consistent versions across a cluster
(mostly to have feature parity and latest security updates)
It's not mandatory
(otherwise, cluster upgrades would be a nightmare!)
Components can be upgraded one at a time without problems
Checking what we're running
- It's easy to check the version for the API server
Log into node
test1Check the version of kubectl and of the API server:
kubectl version
In a HA setup with multiple API servers, they can have different versions
Running the command above multiple times can return different values
Node versions
- It's also easy to check the version of kubelet
- Check node versions (includes kubelet, kernel, container engine):kubectl get nodes -o wide
Different nodes can run different kubelet versions
Different nodes can run different kernel versions
Different nodes can run different container engines
Control plane versions
- If the control plane is self-hosted (running in pods), we can check it
- Show image versions for all pods in
kube-systemnamespace:kubectl --namespace=kube-system get pods -o json \| jq -r '.items[]| [.spec.nodeName, .metadata.name]+(.spec.containers[].image | split(":"))| @tsv' \| column -t
What version are we running anyway?
When I say, "I'm running Kubernetes 1.15", is that the version of:
kubectl
API server
kubelet
controller manager
something else?
Other versions that are important
etcd
kube-dns or CoreDNS
CNI plugin(s)
Network controller, network policy controller
Container engine
Linux kernel
General guidelines
To update a component, use whatever was used to install it
If it's a distro package, update that distro package
If it's a container or pod, update that container or pod
If you used configuration management, update with that
Know where your binaries come from
Sometimes, we need to upgrade quickly
(when a vulnerability is announced and patched)
If we are using an installer, we should:
make sure it's using upstream packages
or make sure that whatever packages it uses are current
make sure we can tell it to pin specific component versions
Important questions
Should we upgrade the control plane before or after the kubelets?
Within the control plane, should we upgrade the API server first or last?
How often should we upgrade?
How long are versions maintained?
All the answers are in the documentation about version skew policy!
Let's review the key elements together ...
Kubernetes uses semantic versioning
Kubernetes versions look like MAJOR.MINOR.PATCH; e.g. in 1.17.2:
- MAJOR = 1
- MINOR = 17
- PATCH = 2
It's always possible to mix and match different PATCH releases
(e.g. 1.16.1 and 1.16.6 are compatible)
It is recommended to run the latest PATCH release
(but it's mandatory only when there is a security advisory)
Version skew
API server must be more recent than its clients (kubelet and control plane)
... Which means it must always be upgraded first
All components support a difference of one¹ MINOR version
This allows live upgrades (since we can mix e.g. 1.15 and 1.16)
It also means that going from 1.14 to 1.16 requires going through 1.15
¹Except kubelet, which can be up to two MINOR behind API server, and kubectl, which can be one MINOR ahead or behind API server.
Release cycle
There is a new PATCH relese whenever necessary
(every few weeks, or "ASAP" when there is a security vulnerability)
There is a new MINOR release every 3 months (approximately)
At any given time, three MINOR releases are maintained
... Which means that MINOR releases are maintained approximately 9 months
We should expect to upgrade at least every 3 months (on average)
In practice
We are going to update a few cluster components
We will change the kubelet version on one node
We will change the version of the API server
We will work with cluster
test(nodestest1,test2,test3)
Updating the API server
This cluster has been deployed with kubeadm
The control plane runs in static pods
These pods are started automatically by kubelet
(even when kubelet can't contact the API server)
They are defined in YAML files in
/etc/kubernetes/manifests(this path is set by a kubelet command-line flag)
kubelet automatically updates the pods when the files are changed
Changing the API server version
- We will edit the YAML file to use a different image version
Log into node
test1Check API server version:
kubectl versionEdit the API server pod manifest:
sudo vim /etc/kubernetes/manifests/kube-apiserver.yamlLook for the
image:line, and update it to e.g.v1.16.0
Checking what we've done
- The API server will be briefly unavailable while kubelet restarts it
- Check the API server version:kubectl version
Was that a good idea?
Was that a good idea?
No!
Was that a good idea?
No!
Remember the guideline we gave earlier:
To update a component, use whatever was used to install it.
This control plane was deployed with kubeadm
We should use kubeadm to upgrade it!
Updating the whole control plane
Let's make it right, and use kubeadm to upgrade the entire control plane
(note: this is possible only because the cluster was installed with kubeadm)
- Check what will be upgraded:sudo kubeadm upgrade plan
Note 1: kubeadm thinks that our cluster is running 1.16.0.
It is confused by our manual upgrade of the API server!
Note 2: kubeadm itself is still version 1.15.9.
It doesn't know how to upgrade do 1.16.X.
Upgrading kubeadm
- First things first: we need to upgrade kubeadm
Upgrade kubeadm:
sudo apt install kubeadmCheck what kubeadm tells us:
sudo kubeadm upgrade plan
Problem: kubeadm doesn't know know how to handle upgrades from version 1.15.
This is because we installed version 1.17 (or even later).
We need to install kubeadm version 1.16.X.
Downgrading kubeadm
- We need to go back to version 1.16.X (e.g. 1.16.6)
View available versions for package
kubeadm:apt show kubeadm -a | grep ^Version | grep 1.16Downgrade kubeadm:
sudo apt install kubeadm=1.16.6-00Check what kubeadm tells us:
sudo kubeadm upgrade plan
kubeadm should now agree to upgrade to 1.16.6.
Upgrading the cluster with kubeadm
Ideally, we should revert our
image:change(so that kubeadm executes the right migration steps)
Or we can try the upgrade anyway
- Perform the upgrade:sudo kubeadm upgrade apply v1.16.6
Updating kubelet
These nodes have been installed using the official Kubernetes packages
We can therefore use
aptorapt-get
Log into node
test3View available versions for package
kubelet:apt show kubelet -a | grep ^VersionUpgrade kubelet:
sudo apt install kubelet=1.16.6-00
Checking what we've done
Log into node
test1Check node versions:
kubectl get nodes -o wideCreate a deployment and scale it to make sure that the node still works
Was that a good idea?
Was that a good idea?
Almost!
Was that a good idea?
Almost!
Yes, kubelet was installed with distribution packages
However, kubeadm took care of configuring kubelet
(when doing
kubeadm join ...)We were supposed to run a special command before upgrading kubelet!
That command should be executed on each node
It will download the kubelet configuration generated by kubeadm
Upgrading kubelet the right way
We need to upgrade kubeadm, upgrade kubelet config, then upgrade kubelet
(after upgrading the control plane)
- Download the configuration on each node, and upgrade kubelet:for N in 1 2 3; dossh test$N "sudo apt install kubeadm=1.16.6-00 &&sudo kubeadm upgrade node &&sudo apt install kubelet=1.16.6-00"done
Checking what we've done
- All our nodes should now be updated to version 1.16.6
- Check nodes versions:kubectl get nodes -o wide
Skipping versions
This example worked because we went from 1.15 to 1.16
If you are upgrading from e.g. 1.14, you will have to go through 1.15 first
This means upgrading kubeadm to 1.15.X, then using it to upgrade the cluster
Then upgrading kubeadm to 1.16.X, etc.
Make sure to read the release notes before upgrading!
:EN:- Best practices for cluster upgrades :EN:- Example: upgrading a kubeadm cluster
:FR:- Bonnes pratiques pour la mise à jour des clusters :FR:- Exemple : mettre à jour un cluster kubeadm
Backing up clusters
(automatically generated title slide)
Backing up clusters
Backups can have multiple purposes:
disaster recovery (servers or storage are destroyed or unreachable)
error recovery (human or process has altered or corrupted data)
cloning environments (for testing, validation...)
Let's see the strategies and tools available with Kubernetes!
Important
Kubernetes helps us with disaster recovery
(it gives us replication primitives)
Kubernetes helps us clone / replicate environments
(all resources can be described with manifests)
Kubernetes does not help us with error recovery
We still need to back up/snapshot our data:
with database backups (mysqldump, pgdump, etc.)
and/or snapshots at the storage layer
and/or traditional full disk backups
In a perfect world ...
The deployment of our Kubernetes clusters is automated
(recreating a cluster takes less than a minute of human time)
All the resources (Deployments, Services...) on our clusters are under version control
(never use
kubectl run; always apply YAML files coming from a repository)Stateful components are either:
stored on systems with regular snapshots
backed up regularly to an external, durable storage
outside of Kubernetes
Kubernetes cluster deployment
If our deployment system isn't fully automated, it should at least be documented
Litmus test: how long does it take to deploy a cluster...
for a senior engineer?
for a new hire?
Does it require external intervention?
(e.g. provisioning servers, signing TLS certs...)
Plan B
Full machine backups of the control plane can help
If the control plane is in pods (or containers), pay attention to storage drivers
(if the backup mechanism is not container-aware, the backups can take way more resources than they should, or even be unusable!)
If the previous sentence worries you:
automate the deployment of your clusters!
Managing our Kubernetes resources
Ideal scenario:
never create a resource directly on a cluster
push to a code repository
a special branch (
productionor evenmaster) gets automatically deployed
Some folks call this "GitOps"
(it's the logical evolution of configuration management and infrastructure as code)
GitOps in theory
What do we keep in version control?
For very simple scenarios: source code, Dockerfiles, scripts
For real applications: add resources (as YAML files)
For applications deployed multiple times: Helm, Kustomize...
(staging and production count as "multiple times")
GitOps tooling
Various tools exist (Weave Flux, GitKube...)
These tools are still very young
You still need to write YAML for all your resources
There is no tool to:
list all resources in a namespace
get resource YAML in a canonical form
diff YAML descriptions with current state
GitOps in practice
Start describing your resources with YAML
Leverage a tool like Kustomize or Helm
Make sure that you can easily deploy to a new namespace
(or even better: to a new cluster)
When tooling matures, you will be ready
Plan B
What if we can't describe everything with YAML?
What if we manually create resources and forget to commit them to source control?
What about global resources, that don't live in a namespace?
How can we be sure that we saved everything?
Backing up etcd
All objects are saved in etcd
etcd data should be relatively small
(and therefore, quick and easy to back up)
Two options to back up etcd:
snapshot the data directory
use
etcdctl snapshot
Making an etcd snapshot
The basic command is simple:
etcdctl snapshot save <filename>But we also need to specify:
an environment variable to specify that we want etcdctl v3
the address of the server to back up
the path to the key, certificate, and CA certificate
(if our etcd uses TLS certificates)
Snapshotting etcd on kubeadm
The following command will work on clusters deployed with kubeadm
(and maybe others)
It should be executed on a master node
docker run --rm --net host -v $PWD:/vol \ -v /etc/kubernetes/pki/etcd:/etc/kubernetes/pki/etcd:ro \ -e ETCDCTL_API=3 k8s.gcr.io/etcd:3.3.10 \ etcdctl --endpoints=https://[127.0.0.1]:2379 \ --cacert=/etc/kubernetes/pki/etcd/ca.crt \ --cert=/etc/kubernetes/pki/etcd/healthcheck-client.crt \ --key=/etc/kubernetes/pki/etcd/healthcheck-client.key \ snapshot save /vol/snapshot- It will create a file named
snapshotin the current directory
How can we remember all these flags?
Older versions of kubeadm did add a healthcheck probe with all these flags
That healthcheck probe was calling
etcdctlwith all the right flagsWith recent versions of kubeadm, we're on our own!
Exercise: write the YAML for a batch job to perform the backup
(how will you access the key and certificate required to connect?)
Restoring an etcd snapshot
Execute exactly the same command, but replacingsavewithrestore(Believe it or not, doing that will not do anything useful!)
The
restorecommand does not load a snapshot into a running etcd serverThe
restorecommand creates a new data directory from the snapshot(it's an offline operation; it doesn't interact with an etcd server)
It will create a new data directory in a temporary container
(leaving the running etcd node untouched)
When using kubeadm
Create a new data directory from the snapshot:
sudo rm -rf /var/lib/etcddocker run --rm -v /var/lib:/var/lib -v $PWD:/vol \-e ETCDCTL_API=3 k8s.gcr.io/etcd:3.3.10 \etcdctl snapshot restore /vol/snapshot --data-dir=/var/lib/etcdProvision the control plane, using that data directory:
sudo kubeadm init \--ignore-preflight-errors=DirAvailable--var-lib-etcdRejoin the other nodes
The fine print
This only saves etcd state
It does not save persistent volumes and local node data
Some critical components (like the pod network) might need to be reset
As a result, our pods might have to be recreated, too
If we have proper liveness checks, this should happen automatically
More information about etcd backups
Kubernetes documentation about etcd backups
etcd documentation about snapshots and restore
A good blog post by elastisys explaining how to restore a snapshot
Another good blog post by consol labs on the same topic
Don't forget ...
Also back up the TLS information
(at the very least: CA key and cert; API server key and cert)
With clusters provisioned by kubeadm, this is in
/etc/kubernetes/pkiIf you don't:
you will still be able to restore etcd state and bring everything back up
you will need to redistribute user certificates
TLS information is highly sensitive!
Anyone who has it has full access to your cluster!
Stateful services
It's totally fine to keep your production databases outside of Kubernetes
Especially if you have only one database server!
Feel free to put development and staging databases on Kubernetes
(as long as they don't hold important data)
Using Kubernetes for stateful services makes sense if you have many
(because then you can leverage Kubernetes automation)
Snapshotting persistent volumes
Option 1: snapshot volumes out of band
(with the API/CLI/GUI of our SAN/cloud/...)
Option 2: storage system integration
(e.g. Portworx can create snapshots through annotations)
Option 3: snapshots through Kubernetes API
(Generally available since Kuberentes 1.20 for a number of CSI volume plugins : GCE, OpenSDS, Ceph, Portworx, etc)
More backup tools
-
back up Kubernetes persistent volumes
-
cluster state management
Heptio ArkVelerofull cluster backup
-
simple scripts to save resource YAML to a git repository
-
Backup Interface for Volumes Attached to Containers
:EN:- Backing up clusters :FR:- Politiques de sauvegarde
The Cloud Controller Manager
(automatically generated title slide)
The Cloud Controller Manager
Kubernetes has many features that are cloud-specific
(e.g. providing cloud load balancers when a Service of type LoadBalancer is created)
These features were initially implemented in API server and controller manager
Since Kubernetes 1.6, these features are available through a separate process:
the Cloud Controller Manager
The CCM is optional, but if we run in a cloud, we probably want it!
k8s/cloud-controller-manager.md
Cloud Controller Manager duties
Creating and updating cloud load balancers
Configuring routing tables in the cloud network (specific to GCE)
Updating node labels to indicate region, zone, instance type...
Obtain node name, internal and external addresses from cloud metadata service
Deleting nodes from Kubernetes when they're deleted in the cloud
Managing some volumes (e.g. ELBs, AzureDisks...)
(Eventually, volumes will be managed by the Container Storage Interface)
k8s/cloud-controller-manager.md
In-tree vs. out-of-tree
A number of cloud providers are supported "in-tree"
(in the main kubernetes/kubernetes repository on GitHub)
More cloud providers are supported "out-of-tree"
(with code in different repositories)
There is an ongoing effort to move everything to out-of-tree providers
k8s/cloud-controller-manager.md
In-tree providers
The following providers are actively maintained:
- Amazon Web Services
- Azure
- Google Compute Engine
- IBM Cloud
- OpenStack
- VMware vSphere
These ones are less actively maintained:
- Apache CloudStack
- oVirt
- VMware Photon
k8s/cloud-controller-manager.md
Out-of-tree providers
The list includes the following providers:
DigitalOcean
keepalived (not exactly a cloud; provides VIPs for load balancers)
Linode
Oracle Cloud Infrastructure
(And possibly others; there is no central registry for these.)
k8s/cloud-controller-manager.md
Audience questions
What kind of clouds are you using/planning to use?
What kind of details would you like to see in this section?
Would you appreciate details on clouds that you don't / won't use?
k8s/cloud-controller-manager.md
Cloud Controller Manager in practice
Write a configuration file
(typically
/etc/kubernetes/cloud.conf)Run the CCM process
(on self-hosted clusters, this can be a DaemonSet selecting the control plane nodes)
Start kubelet with
--cloud-provider=externalWhen using managed clusters, this is done automatically
There is very little documentation on writing the configuration file
(except for OpenStack)
k8s/cloud-controller-manager.md
Bootstrapping challenges
When a node joins the cluster, it needs to obtain a signed TLS certificate
That certificate must contain the node's addresses
These addresses are provided by the Cloud Controller Manager
(at least the external address)
To get these addresses, the node needs to communicate with the control plane
...Which means joining the cluster
(The problem didn't occur when cloud-specific code was running in kubelet: kubelet could obtain the required information directly from the cloud provider's metadata service.)
k8s/cloud-controller-manager.md
More information about CCM
CCM configuration and operation is highly specific to each cloud provider
(which is why this section remains very generic)
The Kubernetes documentation has some information:
configuration (mainly for OpenStack)
:EN:- The Cloud Controller Manager :FR:- Le Cloud Controller Manager
Git-based workflows
(automatically generated title slide)
Git-based workflows
Deploying with
kubectlhas downsides:we don't know who deployed what and when
there is no audit trail (except the API server logs)
there is no easy way to undo most operations
there is no review/approval process (like for code reviews)
We have all these things for code, though
Can we manage cluster state like we manage our source code?
Reminder: Kubernetes is declarative
All we do is create/change resources
These resources have a perfect YAML representation
All we do is manipulating these YAML representations
(
kubectl rungenerates a YAML file that gets applied)We can store these YAML representations in a code repository
We can version that code repository and maintain it with best practices
define which branch(es) can go to qa/staging/production
control who can push to which branches
have formal review processes, pull requests ...
Enabling git-based workflows
There are a few tools out there to help us do that
There are many other tools, some of them with even more features
There are also many integrations with popular CI/CD systems
(e.g.: GitLab, Jenkins, ...) k8s/gitworkflows.md
Flux overview
We put our Kubernetes resources as YAML files in a git repository
Flux polls that repository regularly (every 5 minutes by default)
The resources described by the YAML files are created/updated automatically
Changes are made by updating the code in the repository
Preparing a repository for Flux
We need a repository with Kubernetes YAML files
I have one: https://github.com/jpetazzo/kubercoins
Fork it to your GitHub account
Create a new branch in your fork; e.g.
prod(e.g. by adding a line in the README through the GitHub web UI)
This is the branch that we are going to use for deployment
Setting up Flux
Clone the Flux repository:
git clone https://github.com/fluxcd/fluxEdit
deploy/flux-deployment.yamlChange the
--git-urland--git-branchparameters:- --git-url=git@github.com:your-git-username/kubercoins- --git-branch=prodApply all the YAML:
kubectl apply -f deploy/
Allowing Flux to access the repository
When it starts, Flux generates an SSH key
Display that key:
kubectl logs deployment/flux | grep identityThen add that key to the repository, giving it write access
(some Flux features require write access)
After a minute or so, DockerCoins will be deployed to the current namespace
Making changes
Make changes (on the
prodbranch), e.g. changereplicasinworkerAfter a few minutes, the changes will be picked up by Flux and applied
Other features
Flux can keep a list of all the tags of all the images we're running
The
fluxctltool can show us if we're running the latest imagesWe can also "automate" a resource (i.e. automatically deploy new images)
And much more!
Gitkube overview
We put our Kubernetes resources as YAML files in a git repository
Gitkube is a git server (or "git remote")
After making changes to the repository, we push to Gitkube
Gitkube applies the resources to the cluster
Setting up Gitkube
Install the CLI:
sudo curl -L -o /usr/local/bin/gitkube \https://github.com/hasura/gitkube/releases/download/v0.2.1/gitkube_linux_amd64sudo chmod +x /usr/local/bin/gitkubeInstall Gitkube on the cluster:
gitkube install --expose ClusterIP
Creating a Remote
Gitkube provides a new type of API resource: Remote
(this is using a mechanism called Custom Resource Definitions or CRD)
Create and apply a YAML file containing the following manifest:
apiVersion: gitkube.sh/v1alpha1kind: Remotemetadata:name: examplespec:authorizedKeys:- ssh-rsa AAA...manifests:path: "."(replace the
ssh-rsa AAA...section with the content of~/.ssh/id_rsa.pub)
Pushing to our remote
Get the
gitkubedIP address:kubectl -n kube-system get svc gitkubedIP=$(kubectl -n kube-system get svc gitkubed -o json |jq -r .spec.clusterIP)Get ourselves a sample repository with resource YAML files:
git clone git://github.com/jpetazzo/kubercoinscd kubercoinsAdd the remote and push to it:
git remote add k8s ssh://default-example@$IP/~/git/default-examplegit push k8s master
Making changes
Edit a local file
Commit
Push!
Make sure that you push to the
k8sremote
Other features
Gitkube can also build container images for us
(see the documentation for more details)
Gitkube can also deploy Helm charts
(instead of raw YAML files)
:EN:- GitOps :FR:- GitOps
Last words
(automatically generated title slide)
Last words
Congratulations!
We learned a lot about Kubernetes, its internals, its advanced concepts
Last words
Congratulations!
We learned a lot about Kubernetes, its internals, its advanced concepts
That was just the easy part
The hard challenges will revolve around culture and people
Last words
Congratulations!
We learned a lot about Kubernetes, its internals, its advanced concepts
That was just the easy part
The hard challenges will revolve around culture and people
... What does that mean?
Running an app involves many steps
Write the app
Tests, QA ...
Ship something (more on that later)
Provision resources (e.g. VMs, clusters)
Deploy the something on the resources
Manage, maintain, monitor the resources
Manage, maintain, monitor the app
And much more
Who does what?
The old "devs vs ops" division has changed
In some organizations, "ops" are now called "SRE" or "platform" teams
(and they have very different sets of skills)
Do you know which team is responsible for each item on the list on the previous page?
Acknowledge that a lot of tasks are outsourced
(e.g. if we add "buy/rack/provision machines" in that list)
What do we ship?
Some organizations embrace "you build it, you run it"
When "build" and "run" are owned by different teams, where's the line?
What does the "build" team ship to the "run" team?
Let's see a few options, and what they imply
Shipping code
Team "build" ships code
(hopefully in a repository, identified by a commit hash)
Team "run" containerizes that code
✔️ no extra work for developers
❌ very little advantage of using containers
Shipping container images
Team "build" ships container images
(hopefully built automatically from a source repository)
Team "run" uses theses images to create e.g. Kubernetes resources
✔️ universal artefact (support all languages uniformly)
✔️ easy to start a single component (good for monoliths)
❌ complex applications will require a lot of extra work
❌ adding/removing components in the stack also requires extra work
❌ complex applications will run very differently between dev and prod
Shipping Compose files
(Or another kind of dev-centric manifest)
Team "build" ships a manifest that works on a single node
(as well as images, or ways to build them)
Team "run" adapts that manifest to work on a cluster
✔️ all teams can start the stack in a reliable, deterministic manner
❌ adding/removing components still requires some work (but less than before)
❌ there will be some differences between dev and prod
Shipping Kubernetes manifests
Team "build" ships ready-to-run manifests
(YAML, Helm charts, Kustomize ...)
Team "run" adjusts some parameters and monitors the application
✔️ parity between dev and prod environments
✔️ "run" team can focus on SLAs, SLOs, and overall quality
❌ requires a lot of extra work (and new skills) from the "build" team
❌ Kubernetes is not a very convenient development platform (at least, not yet)
What's the right answer?
It depends on our teams
existing skills (do they know how to do it?)
availability (do they have the time to do it?)
potential skills (can they learn to do it?)
It depends on our culture
owning "run" often implies being on call
do we reward on-call duty without encouraging hero syndrome?
do we give people resources (time, money) to learn?
Tools to develop on Kubernetes
If we decide to make Kubernetes the primary development platform, here are a few tools that can help us.
Docker Desktop
Draft
Minikube
Skaffold
Tilt
...
Where do we run?
Managed vs. self-hosted
Cloud vs. on-premises
If cloud: public vs. private
Which vendor/distribution to pick?
Which versions/features to enable?
Developer experience
These questions constitute a quick "smoke test" for our strategy:
How do we on-board a new developer?
What do they need to install to get a dev stack?
How does a code change make it from dev to prod?
How does someone add a component to a stack?
Some guidelines
Start small
Outsource what we don't know
Start simple, and stay simple as long as possible
(try to stay away from complex features that we don't need)
Automate
(regularly check that we can successfully redeploy by following scripts)
Transfer knowledge
(make sure everyone is on the same page/level)
Iterate!
Links and resources
(automatically generated title slide)
Links and resources
All things Kubernetes:
- Kubernetes Community - Slack, Google Groups, meetups
- Kubernetes on StackOverflow
- Play With Kubernetes Hands-On Labs
All things Docker:
Everything else:
These slides (and future updates) are on → http://container.training/